Coca Cola 2010 Annual Report Download - page 70
Download and view the complete annual report
Please find page 70 of the 2010 Coca Cola annual report below. You can navigate through the pages in the report by either clicking on the pages listed below, or by using the keyword search tool below to find specific information within the annual report.-
 1
1 -
2
-
3
-
4
-
5
-
6
-
7
-
8
-
9
-
10
-
11
-
12
-
13
-
14
-
15
-
16
-
17
-
18
-
19
-
20
-
21
-
22
-
23
-
24
-
25
-
26
-
27
-
28
-
29
-
30
-
31
-
32
-
33
-
34
-
35
-
36
-
37
-
38
-
39
-
40
-
41
-
42
-
43
-
44
-
45
-
46
-
47
-
48
-
49
-
50
-
51
-
52
-
53
-
54
-
55
-
56
-
57
-
58
-
59
-
 60
60 -
 61
61 -
 62
62 -
 63
63 -
 64
64 -
 65
65 -
 66
66 -
 67
67 -
 68
68 -
 69
69 -
 70
70 -
 71
71 -
 72
72 -
 73
73 -
 74
74 -
 75
75 -
 76
76 -
 77
77 -
 78
78 -
 79
79 -
 80
80 -
81
-
82
-
83
-
84
-
85
-
86
-
87
-
88
-
89
-
90
-
91
-
92
-
93
-
94
-
95
-
96
-
97
-
98
-
99
-
100
-
101
-
102
-
103
-
104
-
105
-
106
-
107
-
108
-
109
-
110
-
111
-
112
-
113
-
114
-
115
-
116
-
117
-
118
-
119
-
120
-
121
-
122
-
123
-
124
-
125
-
126
-
127
-
128
-
129
-
130
-
131
-
132
-
133
-
134
-
135
-
136
-
137
-
138
-
139
-
140
-
141
-
142
-
143
-
144
-
145
-
146
-
147
-
148
-
149
-
150
-
151
-
152
-
153
-
154
-
155
-
156
-
157
-
158
-
159
-
160
-
161
-
162
-
163
-
164
-
165
-
166
-
167
-
168
-
169
-
170
-
171
-
172
-
173
-
174
-
175
-
176
-
177
-
178
-
179
-
180
-
181
-
182
-
183
-
184
 |
 |
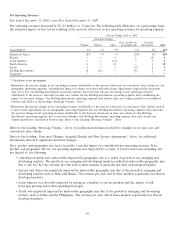
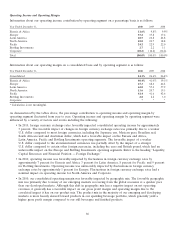
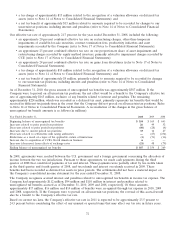
• In 2009, shifts in our marketing and media spend strategies favorably impacted the operating margin in the
majority of our operating segments. The shift was primarily due to spending more marketing dollars toward
in-store activations, improving shelf impact, loyalty points programs and point-of-sale marketing. Many of these
strategies are recorded as deductions from revenues instead of marketing expenses. Refer to the heading ‘‘Net
Operating Revenues,’’ above.
• In 2009, lower commodity prices favorably impacted North America’s operating margin.
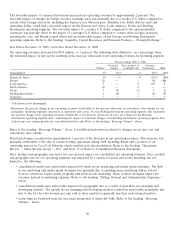
• In 2009, the operating margins for the Latin America and North America operating segments were unfavorably
impacted by the growth of our finished goods businesses. Generally, bottling and finished products operations
produce higher net revenues but lower operating margins compared to concentrate and syrup operations.
• In 2009, our consolidated operating margin was favorably impacted by the sale of certain bottling operations
during 2008, including Remil and a portion of our ownership interest in Coca-Cola Pakistan, which resulted in its
deconsolidation. Generally, bottling and finished products operations produce higher net revenues but lower
operating margins compared to concentrate and syrup operations.
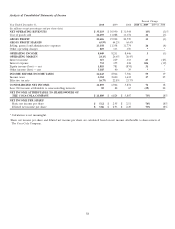
• In 2009, operating income was reduced by approximately $4 million for Eurasia and Africa, $7 million for
Europe, $31 million for North America, $1 million for Pacific, $141 million for Bottling Investments and
$129 million for Corporate, primarily as a result of restructuring costs, the Company’s ongoing productivity
initiatives and asset impairments. Refer to the heading ‘‘Other Operating Charges,’’ above.
• In 2008, operating income was reduced by approximately $1 million for Eurasia and Africa, $1 million for
Latin America, $56 million for North America, $46 million for Bottling Investments and $246 million for
Corporate, primarily due to restructuring costs, contract termination fees, productivity initiatives and asset
impairments. Refer to the heading ‘‘Other Operating Charges,’’ above.
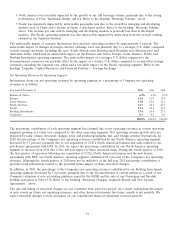
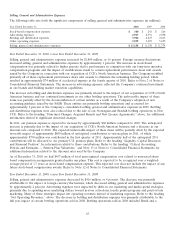
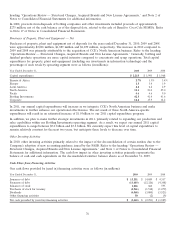
Interest Income
Year Ended December 31, 2010, versus Year Ended December 31, 2009
Interest income increased by $68 million, or 27 percent. The increase was primarily due to the impact of higher average
cash and short-term investment balances, partially offset by lower average interest rates.
Year Ended December 31, 2009, versus Year Ended December 31, 2008
Interest income decreased by $84 million, or 25 percent. This decrease was primarily attributable to lower interest rates,
partially offset by the impact of higher short-term investment balances.
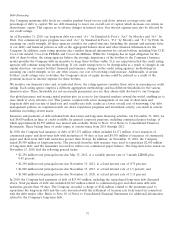
Interest Expense
Year Ended December 31, 2010, versus Year Ended December 31, 2009
Interest expense increased $378 million, primarily due to a $342 million charge related to the premiums paid to
repurchase long-term debt and the costs associated with the settlement of treasury rate locks issued in connection with
the debt tender offer. The increase also reflects the impact of interest expense on debt assumed from CCE. In
connection with the Company’s acquisition of CCE’s North American business, we assumed $266 million of short-term
borrowings and $7,602 million of long-term debt. The estimated fair value of the long-term debt was approximately
$9,345 million as of the acquisition date. In accordance with accounting principles generally accepted in the United
States, we recorded the assumed debt at its fair value as of the acquisition date. On November 15, 2010, the Company
issued $4,500 million of long-term notes and used some of the proceeds to repurchase $2,910 million of long-term debt.
The remaining cash from the issuance was used to reduce our outstanding commercial paper balance.
As of December 31, 2010, the carrying value of the Company’s long-term debt included approximately $994 million of
fair value adjustments related to the debt assumed from CCE. These fair value adjustments will be amortized over a
weighted-average period of approximately 15 years, which is equal to the weighted-average maturity of the assumed
debt to which these fair value adjustments relate. The amortization of these fair value adjustments will be a reduction
of interest expense in future periods, which will typically result in our interest expense being less than the actual interest
paid to service the debt. Total interest paid was $422 million in 2010.
68