Coca Cola 2010 Annual Report Download - page 52
Download and view the complete annual report
Please find page 52 of the 2010 Coca Cola annual report below. You can navigate through the pages in the report by either clicking on the pages listed below, or by using the keyword search tool below to find specific information within the annual report.-
 1
1 -
2
-
3
-
4
-
5
-
6
-
7
-
8
-
9
-
10
-
11
-
12
-
13
-
14
-
15
-
16
-
17
-
18
-
19
-
20
-
21
-
22
-
23
-
24
-
25
-
26
-
27
-
28
-
29
-
30
-
31
-
32
-
33
-
34
-
35
-
36
-
37
-
38
-
39
-
40
-
41
-
 42
42 -
 43
43 -
 44
44 -
 45
45 -
 46
46 -
 47
47 -
 48
48 -
 49
49 -
 50
50 -
 51
51 -
 52
52 -
 53
53 -
 54
54 -
 55
55 -
 56
56 -
 57
57 -
 58
58 -
 59
59 -
 60
60 -
 61
61 -
 62
62 -
63
-
64
-
65
-
66
-
67
-
68
-
69
-
70
-
71
-
72
-
73
-
74
-
75
-
76
-
77
-
78
-
79
-
80
-
81
-
82
-
83
-
84
-
85
-
86
-
87
-
88
-
89
-
90
-
91
-
92
-
93
-
94
-
95
-
96
-
97
-
98
-
99
-
100
-
101
-
102
-
103
-
104
-
105
-
106
-
107
-
108
-
109
-
110
-
111
-
112
-
113
-
114
-
115
-
116
-
117
-
118
-
119
-
120
-
121
-
122
-
123
-
124
-
125
-
126
-
127
-
128
-
129
-
130
-
131
-
132
-
133
-
134
-
135
-
136
-
137
-
138
-
139
-
140
-
141
-
142
-
143
-
144
-
145
-
146
-
147
-
148
-
149
-
150
-
151
-
152
-
153
-
154
-
155
-
156
-
157
-
158
-
159
-
160
-
161
-
162
-
163
-
164
-
165
-
166
-
167
-
168
-
169
-
170
-
171
-
172
-
173
-
174
-
175
-
176
-
177
-
178
-
179
-
180
-
181
-
182
-
183
-
184
 |
 |
factors that can influence that determination are local restrictions on remittances (for example, in some countries a
central bank application and approval are required in order for the Company’s local country subsidiary to pay a
dividend), economic stability, and asset risk. As of December 31, 2010, undistributed earnings of the Company’s foreign
subsidiaries that met the indefinite reversal criteria amounted to $20.8 billion. Refer to Note 14 of Notes to
Consolidated Financial Statements.
The Company’s effective tax rate is expected to be approximately 23.5 percent to 24.5 percent in 2011. This estimated
tax rate does not reflect the impact of any unusual or special items that may affect our tax rate in 2011.
Contingencies
Our Company is subject to various claims and contingencies, mostly related to legal proceedings and tax matters (both
income taxes and indirect taxes). Due to their nature, such legal proceedings and tax matters involve inherent
uncertainties including, but not limited to, court rulings, negotiations between affected parties and governmental
actions. Management assesses the probability of loss for such contingencies and accrues a liability and/or discloses the
relevant circumstances, as appropriate. Management believes that any liability to the Company that may arise as a result
of currently pending legal proceedings, tax matters or other contingencies will not have a material adverse effect on the
financial condition of the Company taken as a whole. Refer to Note 11 of Notes to Consolidated Financial Statements.
Recent Accounting Standards and Pronouncements
Refer to Note 1 of Notes to Consolidated Financial Statements for a discussion of recent accounting standards and
pronouncements.
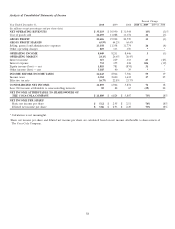
Operations Review
Our organizational structure as of December 31, 2010, consisted of the following operating segments, the first six of
which are sometimes referred to as ‘‘operating groups’’ or ‘‘groups’’: Eurasia and Africa; Europe; Latin America; North
America; Pacific; Bottling Investments; and Corporate. For further information regarding our operating segments, refer
to Note 19 of Notes to Consolidated Financial Statements.
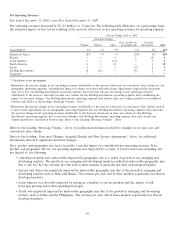
Structural Changes, Acquired Brands and New License Agreements
In order to continually improve upon the Company’s operating performance, from time to time, we engage in buying
and selling ownership interests in bottling partners and other manufacturing operations. In addition, we also acquire
brands or enter into license agreements for certain brands to supplement our beverage offerings. These items impact
our operating results and certain key metrics used by management in assessing the Company’s performance.
Unit case volume growth is a key metric used by management to evaluate the Company’s performance because it
measures demand for our products at the consumer level. The Company’s unit case volume represents the number of
unit cases (or unit case equivalents) of Company beverage products directly or indirectly sold by the Company and its
bottling partners to customers and, therefore, reflects unit case volume for consolidated and unconsolidated bottlers.
Refer to the heading ‘‘Beverage Volume,’’ below.
Concentrate sales volume represents the amount of concentrates and syrups (in all cases expressed in equivalent unit
cases) sold by, or used in finished products sold by, the Company to its bottling partners or other customers. Refer to
the heading ‘‘Beverage Volume,’’ below.
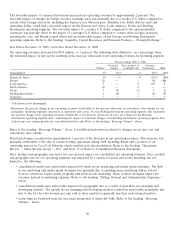
Our Bottling Investments segment and our other finished products operations, including those managed by CCR,
typically generate net operating revenues by selling sparkling beverages and a variety of still beverages, such as juices
and juice drinks, energy and sports drinks, ready-to-drink teas and coffees, and certain water products, to retailers or to
distributors, wholesalers and bottling partners who distribute them to retailers. In addition, in the United States, we
manufacture fountain syrups and sell them to fountain retailers such as restaurants and convenience stores who use the
fountain syrups to produce beverages for immediate consumption, or to authorized fountain wholesalers or bottling
partners who resell the fountain syrups to fountain retailers. For these finished products operations, we recognize the
associated concentrate sales volume at the time the unit case or unit case equivalent is sold to the customer. Our
concentrate operations typically generate net operating revenues by selling concentrates and syrups to authorized
bottling and canning operations. For these concentrate operations, we recognize concentrate revenue and concentrate
50