Coca Cola 2010 Annual Report Download - page 69
Download and view the complete annual report
Please find page 69 of the 2010 Coca Cola annual report below. You can navigate through the pages in the report by either clicking on the pages listed below, or by using the keyword search tool below to find specific information within the annual report.-
 1
1 -
2
-
3
-
4
-
5
-
6
-
7
-
8
-
9
-
10
-
11
-
12
-
13
-
14
-
15
-
16
-
17
-
18
-
19
-
20
-
21
-
22
-
23
-
24
-
25
-
26
-
27
-
28
-
29
-
30
-
31
-
32
-
33
-
34
-
35
-
36
-
37
-
38
-
39
-
40
-
41
-
42
-
43
-
44
-
45
-
46
-
47
-
48
-
49
-
50
-
51
-
52
-
53
-
54
-
55
-
56
-
57
-
58
-
 59
59 -
 60
60 -
 61
61 -
 62
62 -
 63
63 -
 64
64 -
 65
65 -
 66
66 -
 67
67 -
 68
68 -
 69
69 -
 70
70 -
 71
71 -
 72
72 -
 73
73 -
 74
74 -
 75
75 -
 76
76 -
 77
77 -
 78
78 -
 79
79 -
80
-
81
-
82
-
83
-
84
-
85
-
86
-
87
-
88
-
89
-
90
-
91
-
92
-
93
-
94
-
95
-
96
-
97
-
98
-
99
-
100
-
101
-
102
-
103
-
104
-
105
-
106
-
107
-
108
-
109
-
110
-
111
-
112
-
113
-
114
-
115
-
116
-
117
-
118
-
119
-
120
-
121
-
122
-
123
-
124
-
125
-
126
-
127
-
128
-
129
-
130
-
131
-
132
-
133
-
134
-
135
-
136
-
137
-
138
-
139
-
140
-
141
-
142
-
143
-
144
-
145
-
146
-
147
-
148
-
149
-
150
-
151
-
152
-
153
-
154
-
155
-
156
-
157
-
158
-
159
-
160
-
161
-
162
-
163
-
164
-
165
-
166
-
167
-
168
-
169
-
170
-
171
-
172
-
173
-
174
-
175
-
176
-
177
-
178
-
179
-
180
-
181
-
182
-
183
-
184
 |
 |
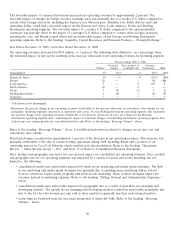
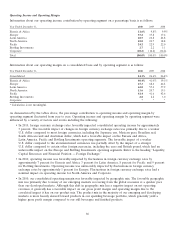
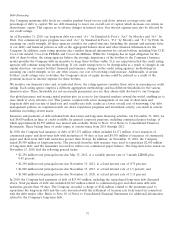
• In 2010, our consolidated operating margin was favorably impacted by the deconsolidation of certain entities as a
result of the Company’s adoption of new accounting guidance issued by the FASB. These entities are primarily
bottling operations and have been accounted for under the equity method of accounting since they were
deconsolidated on January 1, 2010. Generally, bottling and finished products operations produce higher net
revenues but lower operating margins compared to concentrate and syrup operations. The majority of the
deconsolidated entities had previously been included in our Bottling Investments operating segment.
• In 2010, the operating margin for the Latin America operating segment was favorably impacted by the sale of
50 percent of our ownership interest in Le˜
ao Junior resulting in its deconsolidation, as well as the
deconsolidation of certain entities as a result of the Company’s adoption of new accounting guidance issued by
the FASB. Price and product mix also favorably impacted Latin America’s operating income and operating
margin during the year.
• In 2010, the operating margin for the North America operating segment was unfavorably impacted by the
Company’s acquisition of CCE’s North American business. Generally, bottling and finished products operations
have higher net operating revenues but lower operating margins when compared to concentrate and syrup
operations. Refer to the heading ‘‘Structural Changes, Acquired Brands and New License Agreements,’’ above.
• In 2010, operating income for the North America operating segment was reduced by $74 million due to the
acceleration of expense associated with certain share-based replacement awards issued in connection with our
acquisition of CCE’s North American business. Refer to Note 2 of Notes to Consolidated Financial Statements.
• In 2010, operating income for the North America operating segment was negatively impacted by $235 million,
primarily due to the elimination of gross profit in inventory on intercompany sales and an inventory fair value
adjustment as a result of our acquisition of CCE’s North American business. Prior to the acquisition, we
recognized the profit associated with concentrate sales when the concentrate was sold to CCE, excluding the
portion that was deemed to be intercompany due to our previous ownership interest in CCE. However,
subsequent to the acquisition, the Company will not recognize the profit associated with concentrate sold to
CCE’s legacy North American business until the finished beverage products made from those concentrates
are sold.
• In 2010, operating income for the North America operating segment was reduced by $20 million due to the
amortization of favorable supply contracts acquired in connection with our acquisition of CCE’s North American
business.
• In 2010, operating income was reduced by $7 million for Eurasia and Africa, $50 million for Europe,
$133 million for North America, $22 million for Pacific, $122 million for Bottling Investments and $485 million
for Corporate, primarily due to the Company’s productivity, integration and restructuring initiatives, charitable
donations, transaction costs incurred in connection with our acquisition of CCE’s North American business and
the sale of our Norwegian and Swedish bottling operations to New CCE and other charges related to bottling
activities in Eurasia. Refer to the heading ‘‘Other Operating Charges,’’ above.
• In 2009, fluctuations in foreign currency exchange rates unfavorably impacted consolidated operating income by
approximately 11 percent. The unfavorable impact of changes in foreign currency exchange rates was primarily
due to a stronger U.S. dollar compared to most foreign currencies, including the euro, South African rand,
British pound, Brazilian real, Mexican peso and Australian dollar, which had an unfavorable impact on the
Eurasia and Africa, Europe, Latin America, Pacific and Bottling Investments operating segments. The
unfavorable impact of a stronger U.S. dollar compared to the aforementioned currencies was partially offset by
the impact of a weaker U.S. dollar compared to certain other foreign currencies, including the Japanese yen,
which had a favorable impact on the Pacific operating segment. Refer to the heading ‘‘Liquidity, Capital
Resources and Financial Position — Foreign Exchange.’’
• In 2009, operating income was unfavorably impacted by fluctuations in foreign currency exchange rates by
approximately 15 percent for Eurasia and Africa, 11 percent for Europe, 18 percent for Latin America, 1 percent
for North America, 19 percent for Bottling Investments and 4 percent for Corporate. Operating income was
favorably impacted by fluctuations in foreign currency exchange rates by approximately 3 percent for Pacific.
67