Coca Cola 2010 Annual Report Download - page 98
Download and view the complete annual report
Please find page 98 of the 2010 Coca Cola annual report below. You can navigate through the pages in the report by either clicking on the pages listed below, or by using the keyword search tool below to find specific information within the annual report.-
 1
1 -
2
-
3
-
4
-
5
-
6
-
7
-
8
-
9
-
10
-
11
-
12
-
13
-
14
-
15
-
16
-
17
-
18
-
19
-
20
-
21
-
22
-
23
-
24
-
25
-
26
-
27
-
28
-
29
-
30
-
31
-
32
-
33
-
34
-
35
-
36
-
37
-
38
-
39
-
40
-
41
-
42
-
43
-
44
-
45
-
46
-
47
-
48
-
49
-
50
-
51
-
52
-
53
-
54
-
55
-
56
-
57
-
58
-
59
-
60
-
61
-
62
-
63
-
64
-
65
-
66
-
67
-
68
-
69
-
70
-
71
-
72
-
73
-
74
-
75
-
76
-
77
-
78
-
79
-
80
-
81
-
82
-
83
-
84
-
85
-
86
-
87
-
 88
88 -
 89
89 -
 90
90 -
 91
91 -
 92
92 -
 93
93 -
 94
94 -
 95
95 -
 96
96 -
 97
97 -
 98
98 -
 99
99 -
 100
100 -
 101
101 -
 102
102 -
 103
103 -
 104
104 -
 105
105 -
 106
106 -
 107
107 -
 108
108 -
109
-
110
-
111
-
112
-
113
-
114
-
115
-
116
-
117
-
118
-
119
-
120
-
121
-
122
-
123
-
124
-
125
-
126
-
127
-
128
-
129
-
130
-
131
-
132
-
133
-
134
-
135
-
136
-
137
-
138
-
139
-
140
-
141
-
142
-
143
-
144
-
145
-
146
-
147
-
148
-
149
-
150
-
151
-
152
-
153
-
154
-
155
-
156
-
157
-
158
-
159
-
160
-
161
-
162
-
163
-
164
-
165
-
166
-
167
-
168
-
169
-
170
-
171
-
172
-
173
-
174
-
175
-
176
-
177
-
178
-
179
-
180
-
181
-
182
-
183
-
184
 |
 |
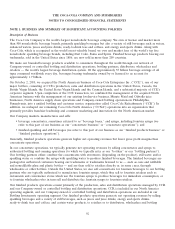
Net Income Per Share
Basic net income per share is computed by dividing net income by the weighted-average number of common shares
outstanding during the reporting period. Diluted net income per share is computed similarly to basic net income per
share, except that it includes the potential dilution that could occur if dilutive securities were exercised. Approximately
38 million, 103 million and 59 million stock option awards were excluded from the computations of diluted net income
per share in 2010, 2009 and 2008, respectively, because the awards would have been antidilutive for the periods
presented.
Cash Equivalents
We classify time deposits and other investments that are highly liquid and have maturities of three months or less at the
date of purchase as cash equivalents. We manage our exposure to counterparty credit risk through specific minimum
credit standards, diversification of counterparties and procedures to monitor our credit risk concentrations.
Short-term Investments
We classify investments in time deposits that have maturities of greater than three months but less than one year as
short-term investments.
Investments in Equity and Debt Securities
We use the equity method to account for our investments in equity securities if our investment gives us the ability to
exercise significant influence over operating and financial policies of the investee. We include our proportionate share
of earnings and/or losses of our equity method investees in equity income (loss) — net in the consolidated statements
of income. The carrying value of our equity investments is reported in equity method investments in our consolidated
balance sheets. Refer to Note 6.
We account for investments in companies that we do not control or account for under the equity method either at fair
value or under the cost method, as applicable. Investments in equity securities are carried at fair value if the fair value
of the security is readily determinable. Equity investments carried at fair value are classified as either trading or
available-for-sale securities with their cost basis determined by the specific identification method. Realized and
unrealized gains and losses on trading securities and realized gains and losses on available-for-sale securities are
included in other income (loss) — net in the consolidated statements of income. Unrealized gains and losses, net of
deferred taxes, on available-for-sale securities are included in our consolidated balance sheets as a component of
accumulated other comprehensive income (loss) (‘‘AOCI’’). Trading securities are reported as either marketable
securities or other assets in our consolidated balance sheets. Securities classified as available-for-sale are reported as
either marketable securities or other investments in our consolidated balance sheets, depending on the length of time
we intend to hold the investment. Refer to Note 3.
Investments in equity securities that we do not control or account for under the equity method and do not have readily
determinable fair values are accounted for under the cost method. Cost method investments are originally recorded at
cost, and we record dividend income when applicable dividends are declared. Cost method investments are reported as
other investments in our consolidated balance sheets, and dividend income from cost method investments is reported in
other income (loss) — net.
Our investments in debt securities are carried at either amortized cost or fair value. Investments in debt securities that
the Company has the positive intent and ability to hold to maturity are carried at amortized cost and classified as
held-to-maturity. Investments in debt securities that are not classified as held-to-maturity are carried at fair value and
classified as either trading or available-for-sale.
Each reporting period we review all of our investments in equity and debt securities, except for those classified as
trading, to determine whether a significant event or change in circumstances has occurred that may have an adverse
effect on the fair value of each investment. When such events or changes occur, we evaluate the fair value compared to
our cost basis in the investment. We also perform this evaluation every reporting period for each investment for which
our cost basis exceeded the fair value in the prior period. The fair values of most of our investments in publicly traded
companies are often readily available based on quoted market prices. For investments in nonpublicly traded companies,
management’s assessment of fair value is based on valuation methodologies including discounted cash flows, estimates
96