Coca Cola 2010 Annual Report Download - page 131
Download and view the complete annual report
Please find page 131 of the 2010 Coca Cola annual report below. You can navigate through the pages in the report by either clicking on the pages listed below, or by using the keyword search tool below to find specific information within the annual report.-
 1
1 -
2
-
3
-
4
-
5
-
6
-
7
-
8
-
9
-
10
-
11
-
12
-
13
-
14
-
15
-
16
-
17
-
18
-
19
-
20
-
21
-
22
-
23
-
24
-
25
-
26
-
27
-
28
-
29
-
30
-
31
-
32
-
33
-
34
-
35
-
36
-
37
-
38
-
39
-
40
-
41
-
42
-
43
-
44
-
45
-
46
-
47
-
48
-
49
-
50
-
51
-
52
-
53
-
54
-
55
-
56
-
57
-
58
-
59
-
60
-
61
-
62
-
63
-
64
-
65
-
66
-
67
-
68
-
69
-
70
-
71
-
72
-
73
-
74
-
75
-
76
-
77
-
78
-
79
-
80
-
81
-
82
-
83
-
84
-
85
-
86
-
87
-
88
-
89
-
90
-
91
-
92
-
93
-
94
-
95
-
96
-
97
-
98
-
99
-
100
-
101
-
102
-
103
-
104
-
105
-
106
-
107
-
108
-
109
-
110
-
111
-
112
-
113
-
114
-
115
-
116
-
117
-
118
-
119
-
120
-
 121
121 -
 122
122 -
 123
123 -
 124
124 -
 125
125 -
 126
126 -
 127
127 -
 128
128 -
 129
129 -
 130
130 -
 131
131 -
 132
132 -
 133
133 -
 134
134 -
 135
135 -
 136
136 -
 137
137 -
 138
138 -
 139
139 -
 140
140 -
 141
141 -
142
-
143
-
144
-
145
-
146
-
147
-
148
-
149
-
150
-
151
-
152
-
153
-
154
-
155
-
156
-
157
-
158
-
159
-
160
-
161
-
162
-
163
-
164
-
165
-
166
-
167
-
168
-
169
-
170
-
171
-
172
-
173
-
174
-
175
-
176
-
177
-
178
-
179
-
180
-
181
-
182
-
183
-
184
 |
 |

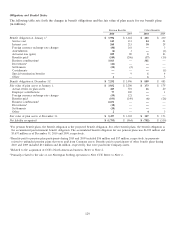
Obligations and Funded Status
The following table sets forth the changes in benefit obligations and the fair value of plan assets for our benefit plans
(in millions):
Pension Benefits Other Benefits
2010 2009 2010 2009
Benefit obligation at January 1,1$ 3,996 $ 3,618 $ 483 $ 430
Service cost 143 113 24 21
Interest cost 260 213 30 29
Foreign currency exchange rate changes (80) 161 —3
Amendments (6) 1—(1)
Actuarial loss (gain) 109 89 123
Benefits paid2(249) (206) (37) (30)
Business combinations33,163 —381 —
Divestitures4(24) ———
Settlements (22) (2) ——
Curtailments ———(1)
Special termination benefits —914
Other 2—65
Benefit obligation at December 31,1$ 7,292 $ 3,996 $ 889 $ 483
Fair value of plan assets at January 1, $ 3,032 $ 2,290 $ 173 $ 175
Actual return on plan assets 445 501 16 20
Employer contributions 77 269 —1
Foreign currency exchange rate changes (59) 121 ——
Benefits paid (193) (149) (6) (26)
Business combinations32,231 ———
Divestitures4(18) ———
Settlements (20) ———
Other 2—43
Fair value of plan assets at December 31, $ 5,497 $ 3,032 $ 187 $ 173
Net liability recognized $ (1,795) $ (964) $ (702) $ (310)
1For pension benefit plans, the benefit obligation is the projected benefit obligation. For other benefit plans, the benefit obligation is
the accumulated postretirement benefit obligation. The accumulated benefit obligation for our pension plans was $6,949 million and
$3,657 million as of December 31, 2010 and 2009, respectively.
2Benefits paid to pension plan participants during 2010 and 2009 included $56 million and $57 million, respectively, in payments
related to unfunded pension plans that were paid from Company assets. Benefits paid to participants of other benefit plans during
2010 and 2009 included $31 million and $4 million, respectively, that were paid from Company assets.
3Related to the acquisition of CCE’s North American business. Refer to Note 2.
4Primarily related to the sale of our Norwegian bottling operation to New CCE. Refer to Note 2.
129