Coca Cola 2010 Annual Report Download - page 110
Download and view the complete annual report
Please find page 110 of the 2010 Coca Cola annual report below. You can navigate through the pages in the report by either clicking on the pages listed below, or by using the keyword search tool below to find specific information within the annual report.-
 1
1 -
2
-
3
-
4
-
5
-
6
-
7
-
8
-
9
-
10
-
11
-
12
-
13
-
14
-
15
-
16
-
17
-
18
-
19
-
20
-
21
-
22
-
23
-
24
-
25
-
26
-
27
-
28
-
29
-
30
-
31
-
32
-
33
-
34
-
35
-
36
-
37
-
38
-
39
-
40
-
41
-
42
-
43
-
44
-
45
-
46
-
47
-
48
-
49
-
50
-
51
-
52
-
53
-
54
-
55
-
56
-
57
-
58
-
59
-
60
-
61
-
62
-
63
-
64
-
65
-
66
-
67
-
68
-
69
-
70
-
71
-
72
-
73
-
74
-
75
-
76
-
77
-
78
-
79
-
80
-
81
-
82
-
83
-
84
-
85
-
86
-
87
-
88
-
89
-
90
-
91
-
92
-
93
-
94
-
95
-
96
-
97
-
98
-
99
-
 100
100 -
 101
101 -
 102
102 -
 103
103 -
 104
104 -
 105
105 -
 106
106 -
 107
107 -
 108
108 -
 109
109 -
 110
110 -
 111
111 -
 112
112 -
 113
113 -
 114
114 -
 115
115 -
 116
116 -
 117
117 -
 118
118 -
 119
119 -
 120
120 -
121
-
122
-
123
-
124
-
125
-
126
-
127
-
128
-
129
-
130
-
131
-
132
-
133
-
134
-
135
-
136
-
137
-
138
-
139
-
140
-
141
-
142
-
143
-
144
-
145
-
146
-
147
-
148
-
149
-
150
-
151
-
152
-
153
-
154
-
155
-
156
-
157
-
158
-
159
-
160
-
161
-
162
-
163
-
164
-
165
-
166
-
167
-
168
-
169
-
170
-
171
-
172
-
173
-
174
-
175
-
176
-
177
-
178
-
179
-
180
-
181
-
182
-
183
-
184
 |
 |

other-than-temporary impairment charges of $26 million. These impairment charges were recorded in other income
(loss) — net. Refer to Note 16 and Note 17. The Company did not sell any available-for-sale securities during 2010.
In 2009, the Company divested certain available-for-sale securities. These divestitures were the result of both sales and
a charitable donation. The sales of available-for-sale securities resulted in cash proceeds of $157 million, gross realized
gains of $44 million and gross realized losses of $2 million. In addition to the sale of available-for-sale securities, the
Company donated certain available-for-sale securities to The Coca-Cola Foundation. The donated investments had a
cost basis of $7 million and a fair value of $106 million at the date of donation. The net impact of this donation was an
expense equal to our cost basis in the securities, which was recorded in other income (loss) — net.
In 2008, the Company realized losses of $81 million due to other-than-temporary impairments of certain
available-for-sale securities. These impairment charges were recorded in other income (loss) — net. Refer to Note 17.
The Company did not sell any available-for-sale securities during 2008.
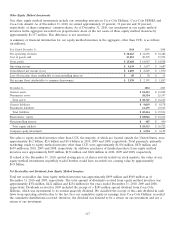
The Company’s available-for-sale and held-to-maturity securities were included in the following captions in our
consolidated balance sheets (in millions):
December 31, 2010 December 31, 2009
Available- Held-to- Available- Held-to-
for-Sale Maturity for-Sale Maturity
Securities Securities Securities Securities
Cash and cash equivalents $ — $ 110 $ — $ 198
Marketable securities 51—1
Other investments, principally bottling companies 471 — 389 —
Other assets 9— 9—
$ 485 $ 111 $ 398 $ 199
The contractual maturities of these investments as of December 31, 2010, were as follows (in millions):
Available-for-Sale Securities Held-to-Maturity Securities
Cost Fair Value Amortized Cost Fair Value
Within 1 year $ 5 $ 5 $ 111 $ 111
After 1 year through 5 years — — — —
After 5 years through 10 years 2 2 — —
After 10 years 7 7 — —
Equity securities 209 471 — —
$ 223 $ 485 $ 111 $ 111
Cost Method Investments
Cost method investments are originally recorded at cost, and we record dividend income when applicable dividends are
declared. Cost method investments are reported as other investments in our consolidated balance sheets, and dividend
income from cost method investments is reported in other income (loss) — net in our consolidated statements of
income. We review all of our cost method investments quarterly to determine if impairment indicators are present;
however, we are not required to determine the fair value of these investments unless impairment indicators exist. When
impairment indicators exist, we generally use discounted cash flow analyses to determine the fair value. We estimate
that the fair values of our cost method investments approximated or exceeded their carrying values as of December 31,
2010 and 2009. Our cost method investments had a carrying value of $159 million and $149 million as of December 31,
2010 and 2009, respectively.
In 2009, the Company recorded a charge of $27 million in other income (loss) — net, as a result of an
other-than-temporary decline in the fair value of a cost method investment. Refer to Note 16 and Note 17 for
additional information related to this impairment.
108