Coca Cola 2010 Annual Report Download - page 155
Download and view the complete annual report
Please find page 155 of the 2010 Coca Cola annual report below. You can navigate through the pages in the report by either clicking on the pages listed below, or by using the keyword search tool below to find specific information within the annual report.-
 1
1 -
2
-
3
-
4
-
5
-
6
-
7
-
8
-
9
-
10
-
11
-
12
-
13
-
14
-
15
-
16
-
17
-
18
-
19
-
20
-
21
-
22
-
23
-
24
-
25
-
26
-
27
-
28
-
29
-
30
-
31
-
32
-
33
-
34
-
35
-
36
-
37
-
38
-
39
-
40
-
41
-
42
-
43
-
44
-
45
-
46
-
47
-
48
-
49
-
50
-
51
-
52
-
53
-
54
-
55
-
56
-
57
-
58
-
59
-
60
-
61
-
62
-
63
-
64
-
65
-
66
-
67
-
68
-
69
-
70
-
71
-
72
-
73
-
74
-
75
-
76
-
77
-
78
-
79
-
80
-
81
-
82
-
83
-
84
-
85
-
86
-
87
-
88
-
89
-
90
-
91
-
92
-
93
-
94
-
95
-
96
-
97
-
98
-
99
-
100
-
101
-
102
-
103
-
104
-
105
-
106
-
107
-
108
-
109
-
110
-
111
-
112
-
113
-
114
-
115
-
116
-
117
-
118
-
119
-
120
-
121
-
122
-
123
-
124
-
125
-
126
-
127
-
128
-
129
-
130
-
131
-
132
-
133
-
134
-
135
-
136
-
137
-
138
-
139
-
140
-
141
-
142
-
143
-
144
-
 145
145 -
 146
146 -
 147
147 -
 148
148 -
 149
149 -
 150
150 -
 151
151 -
 152
152 -
 153
153 -
 154
154 -
 155
155 -
 156
156 -
 157
157 -
 158
158 -
 159
159 -
 160
160 -
 161
161 -
 162
162 -
 163
163 -
 164
164 -
 165
165 -
166
-
167
-
168
-
169
-
170
-
171
-
172
-
173
-
174
-
175
-
176
-
177
-
178
-
179
-
180
-
181
-
182
-
183
-
184
 |
 |

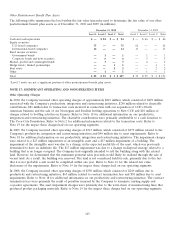
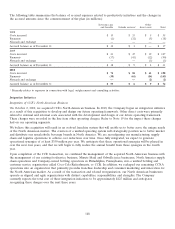
In 2008, the results of our operating segments were impacted by the following items:
• Operating income (loss) and income (loss) before income taxes were reduced by approximately $1 million for
Eurasia and Africa, $1 million for Latin America, $56 million for North America, $46 million for Bottling
Investments and $246 million for Corporate, primarily as a result of the Company’s productivity and restructuring
initiatives, contract termination fees, and asset impairments. Refer to Note 17.
• Equity income (loss) — net and income (loss) before income taxes were reduced by approximately $19 million
for Europe, $8 million for North America and $1,659 million for Bottling Investments, primarily attributable to
our proportionate share of asset impairment charges recorded by equity method investees. Refer to Note 17.
• Income (loss) before income taxes was reduced by approximately $2 million for North America, $30 million for
Bottling Investments and $52 million for Corporate, primarily due to other-than-temporary impairments of
available-for-sale securities. Refer to Note 17.
• Income (loss) before income taxes was increased by approximately $119 million for Bottling Investments and
Corporate, primarily due to the gain on the sale of Remil and the sale of 49 percent of our interest in Coca-Cola
Pakistan. Refer to Note 17.
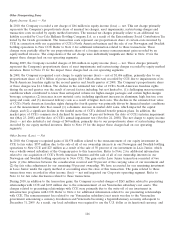
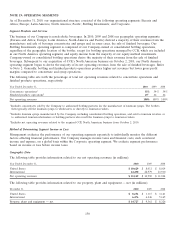
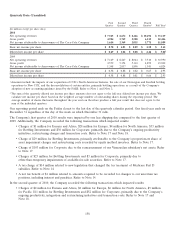
NOTE 20: NET CHANGE IN OPERATING ASSETS AND LIABILITIES
Net cash provided by (used in) operating activities attributable to the net change in operating assets and liabilities is
composed of the following (in millions):
Year Ended December 31, 2010 2009 2008
(Increase) decrease in trade accounts receivable $ (41) $ (404) $ 148
(Increase) decrease in inventories 182 (50) (165)
(Increase) decrease in prepaid expenses and other assets (148) (332) 63
Increase (decrease) in accounts payable and accrued expenses 656 319 (576)
Increase (decrease) in accrued taxes (266) 81 (121)
(Decrease) in other liabilities (13) (178) (104)
Net change in operating assets and liabilities $ 370 $ (564) $ (755)
153