Coca Cola 2010 Annual Report Download - page 80
Download and view the complete annual report
Please find page 80 of the 2010 Coca Cola annual report below. You can navigate through the pages in the report by either clicking on the pages listed below, or by using the keyword search tool below to find specific information within the annual report.-
 1
1 -
2
-
3
-
4
-
5
-
6
-
7
-
8
-
9
-
10
-
11
-
12
-
13
-
14
-
15
-
16
-
17
-
18
-
19
-
20
-
21
-
22
-
23
-
24
-
25
-
26
-
27
-
28
-
29
-
30
-
31
-
32
-
33
-
34
-
35
-
36
-
37
-
38
-
39
-
40
-
41
-
42
-
43
-
44
-
45
-
46
-
47
-
48
-
49
-
50
-
51
-
52
-
53
-
54
-
55
-
56
-
57
-
58
-
59
-
60
-
61
-
62
-
63
-
64
-
65
-
66
-
67
-
68
-
69
-
 70
70 -
 71
71 -
 72
72 -
 73
73 -
 74
74 -
 75
75 -
 76
76 -
 77
77 -
 78
78 -
 79
79 -
 80
80 -
 81
81 -
 82
82 -
 83
83 -
 84
84 -
 85
85 -
 86
86 -
 87
87 -
 88
88 -
 89
89 -
 90
90 -
91
-
92
-
93
-
94
-
95
-
96
-
97
-
98
-
99
-
100
-
101
-
102
-
103
-
104
-
105
-
106
-
107
-
108
-
109
-
110
-
111
-
112
-
113
-
114
-
115
-
116
-
117
-
118
-
119
-
120
-
121
-
122
-
123
-
124
-
125
-
126
-
127
-
128
-
129
-
130
-
131
-
132
-
133
-
134
-
135
-
136
-
137
-
138
-
139
-
140
-
141
-
142
-
143
-
144
-
145
-
146
-
147
-
148
-
149
-
150
-
151
-
152
-
153
-
154
-
155
-
156
-
157
-
158
-
159
-
160
-
161
-
162
-
163
-
164
-
165
-
166
-
167
-
168
-
169
-
170
-
171
-
172
-
173
-
174
-
175
-
176
-
177
-
178
-
179
-
180
-
181
-
182
-
183
-
184
 |
 |

In 2009, the Company had issuances of debt of approximately $14,689 million and payments of debt of $12,326 million.
The issuances of debt included approximately $12,397 million of issuances of commercial paper and short-term debt
with maturities greater than 90 days, as well as $900 million and $1,350 million of long-term debt due March 15, 2014,
and March 15, 2019, respectively. The payments of debt included approximately $1,861 million of net payments of
commercial paper and short-term debt with maturities of 90 days or less; $10,017 million related to commercial paper
and short-term debt with maturities greater than 90 days; and $448 million related to long-term debt. The increase in
issuances and payments of commercial paper with maturities of greater than 90 days was primarily due to a favorable
interest rate environment on longer-term commercial paper. As a result, the Company also began investing in
longer-term time deposits that have maturities of greater than three months. Refer to the heading ‘‘Cash Flows from
Investing Activities.’’
The issuances of debt in 2008 included approximately $4,001 million of issuances of commercial paper and short-term
debt with maturities of greater than 90 days, and approximately $194 million of net issuances of commercial paper and
short-term debt with maturities of 90 days or less. The payments of debt in 2008 included approximately $4,032 million
related to commercial paper and short-term debt with maturities of greater than 90 days.
Issuances of Stock
The issuances of stock in 2010, 2009 and 2008 primarily related to the exercise of stock options by Company employees.
Share Repurchases
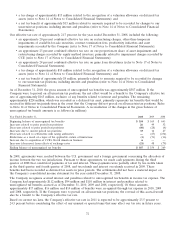
On July 20, 2006, the Board of Directors of the Company authorized a share repurchase program of up to 300 million
shares of the Company’s common stock. The program took effect on October 31, 2006. The table below presents annual
shares repurchased and average price per share:
Year Ended December 31, 2010 2009 2008
Number of shares repurchased (in millions) 49 26 18
Average price per share $ 63.85 $ 57.09 $ 58.01
Since the inception of our initial share repurchase program in 1984 through our current program as of December 31,
2010, we have purchased approximately 1.4 billion shares of our Company’s common stock at an average price per
share of $21.37. In addition to shares repurchased under the stock repurchase plans authorized by our Board of
Directors, the Company’s treasury stock activity also includes shares surrendered to the Company to pay the exercise
price and/or to satisfy tax withholding obligations in connection with so-called stock swap exercises of employee stock
options and/or the vesting of restricted stock issued to employees. In 2010, we repurchased approximately $3.1 billion of
our stock, of which $3.0 billion settled prior to December 31, 2010. We currently expect to repurchase an additional
$2.0 billion to $2.5 billion of our stock during 2011.
Dividends
At its February 2011 meeting, our Board of Directors increased our quarterly dividend by 7 percent, raising it to $0.47
per share, equivalent to a full year dividend of $1.88 per share in 2011. This is our 49th consecutive annual increase.
Our annual common stock dividend was $1.76 per share, $1.64 per share and $1.52 per share in 2010, 2009 and 2008,
respectively. The 2010 dividend represented a 7 percent increase from 2009, and the 2009 dividend represented an
8 percent increase from 2008.
78