Coca Cola 2010 Annual Report Download - page 119
Download and view the complete annual report
Please find page 119 of the 2010 Coca Cola annual report below. You can navigate through the pages in the report by either clicking on the pages listed below, or by using the keyword search tool below to find specific information within the annual report.-
 1
1 -
2
-
3
-
4
-
5
-
6
-
7
-
8
-
9
-
10
-
11
-
12
-
13
-
14
-
15
-
16
-
17
-
18
-
19
-
20
-
21
-
22
-
23
-
24
-
25
-
26
-
27
-
28
-
29
-
30
-
31
-
32
-
33
-
34
-
35
-
36
-
37
-
38
-
39
-
40
-
41
-
42
-
43
-
44
-
45
-
46
-
47
-
48
-
49
-
50
-
51
-
52
-
53
-
54
-
55
-
56
-
57
-
58
-
59
-
60
-
61
-
62
-
63
-
64
-
65
-
66
-
67
-
68
-
69
-
70
-
71
-
72
-
73
-
74
-
75
-
76
-
77
-
78
-
79
-
80
-
81
-
82
-
83
-
84
-
85
-
86
-
87
-
88
-
89
-
90
-
91
-
92
-
93
-
94
-
95
-
96
-
97
-
98
-
99
-
100
-
101
-
102
-
103
-
104
-
105
-
106
-
107
-
108
-
 109
109 -
 110
110 -
 111
111 -
 112
112 -
 113
113 -
 114
114 -
 115
115 -
 116
116 -
 117
117 -
 118
118 -
 119
119 -
 120
120 -
 121
121 -
 122
122 -
 123
123 -
 124
124 -
 125
125 -
 126
126 -
 127
127 -
 128
128 -
 129
129 -
130
-
131
-
132
-
133
-
134
-
135
-
136
-
137
-
138
-
139
-
140
-
141
-
142
-
143
-
144
-
145
-
146
-
147
-
148
-
149
-
150
-
151
-
152
-
153
-
154
-
155
-
156
-
157
-
158
-
159
-
160
-
161
-
162
-
163
-
164
-
165
-
166
-
167
-
168
-
169
-
170
-
171
-
172
-
173
-
174
-
175
-
176
-
177
-
178
-
179
-
180
-
181
-
182
-
183
-
184
 |
 |

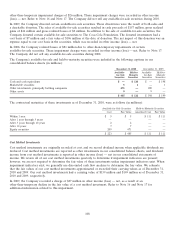
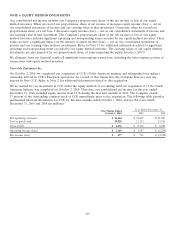
Other Equity Method Investments
Our other equity method investments include our ownership interests in Coca-Cola Hellenic, Coca-Cola FEMSA and
Coca-Cola Amatil. As of December 31, 2010, we owned approximately 23 percent, 32 percent and 30 percent,
respectively, of these companies’ common shares. As of December 31, 2010, our investment in our equity method
investees in the aggregate exceeded our proportionate share of the net assets of these equity method investees by
approximately $1,337 million. This difference is not amortized.
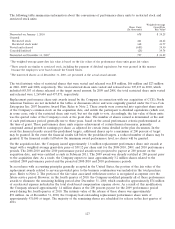
A summary of financial information for our equity method investees in the aggregate, other than CCE, is as follows
(in millions):
Year Ended December 31, 2010 2009 2008
Net operating revenues $ 38,663 $ 34,292 $ 34,482
Cost of goods sold 23,053 20,205 19,974
Gross profit $ 15,610 $ 14,087 $ 14,508
Operating income $ 4,134 $ 3,657 $ 3,687
Consolidated net income (loss) $ 2,659 $ 2,269 $ 1,950
Less: Net income (loss) attributable to noncontrolling interests $89$78$53
Net income (loss) attributable to common shareowners $ 2,570 $ 2,191 $ 1,897
December 31, 2010 2009
Current assets $ 12,223 $ 10,848
Noncurrent assets 26,524 25,397
Total assets $ 38,747 $ 36,245
Current liabilities $ 9,039 $ 8,578
Noncurrent liabilities 11,175 10,945
Total liabilities $ 20,214 $ 19,523
Shareowners’ equity $ 18,046 $ 16,232
Noncontrolling interest $ 487 $ 490
Total equity (deficit) $ 18,533 $ 16,722
Company equity investment $ 6,954 $ 6,192
Net sales to equity method investees other than CCE, the majority of which are located outside the United States, were
approximately $6.2 billion, $5.6 billion and $9.4 billion in 2010, 2009 and 2008, respectively. Total payments, primarily
marketing, made to equity method investees other than CCE were approximately $1,034 million, $878 million and
$659 million in 2010, 2009 and 2008, respectively. In addition, purchases of finished products from equity method
investees were approximately $205 million, $152 million and $228 million in 2010, 2009 and 2008, respectively.
If valued at the December 31, 2010, quoted closing prices of shares actively traded on stock markets, the value of our
equity method investments in publicly traded bottlers would have exceeded our carrying value by approximately
$6.8 billion.
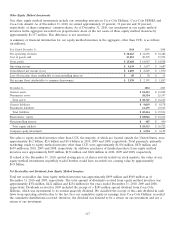
Net Receivables and Dividends from Equity Method Investees
Total net receivables due from equity method investees was approximately $899 million and $949 million as of
December 31, 2010 and 2009, respectively. The total amount of dividends received from equity method investees was
approximately $354 million, $422 million and $254 million for the years ended December 31, 2010, 2009 and 2008,
respectively. Dividends received in 2009 included the receipt of a $183 million special dividend from Coca-Cola
Hellenic, which was incremental to its normal quarterly dividend. We classified the receipt of this cash dividend in cash
flows from operating activities due to the fact that our cumulative equity in earnings from Coca-Cola Hellenic exceeded
the cumulative distributions received; therefore, the dividend was deemed to be a return on our investment and not a
return of our investment.
117