Coca Cola 2010 Annual Report Download - page 62
Download and view the complete annual report
Please find page 62 of the 2010 Coca Cola annual report below. You can navigate through the pages in the report by either clicking on the pages listed below, or by using the keyword search tool below to find specific information within the annual report.-
 1
1 -
2
-
3
-
4
-
5
-
6
-
7
-
8
-
9
-
10
-
11
-
12
-
13
-
14
-
15
-
16
-
17
-
18
-
19
-
20
-
21
-
22
-
23
-
24
-
25
-
26
-
27
-
28
-
29
-
30
-
31
-
32
-
33
-
34
-
35
-
36
-
37
-
38
-
39
-
40
-
41
-
42
-
43
-
44
-
45
-
46
-
47
-
48
-
49
-
50
-
51
-
 52
52 -
 53
53 -
 54
54 -
 55
55 -
 56
56 -
 57
57 -
 58
58 -
 59
59 -
 60
60 -
 61
61 -
 62
62 -
 63
63 -
 64
64 -
 65
65 -
 66
66 -
 67
67 -
 68
68 -
 69
69 -
 70
70 -
 71
71 -
 72
72 -
73
-
74
-
75
-
76
-
77
-
78
-
79
-
80
-
81
-
82
-
83
-
84
-
85
-
86
-
87
-
88
-
89
-
90
-
91
-
92
-
93
-
94
-
95
-
96
-
97
-
98
-
99
-
100
-
101
-
102
-
103
-
104
-
105
-
106
-
107
-
108
-
109
-
110
-
111
-
112
-
113
-
114
-
115
-
116
-
117
-
118
-
119
-
120
-
121
-
122
-
123
-
124
-
125
-
126
-
127
-
128
-
129
-
130
-
131
-
132
-
133
-
134
-
135
-
136
-
137
-
138
-
139
-
140
-
141
-
142
-
143
-
144
-
145
-
146
-
147
-
148
-
149
-
150
-
151
-
152
-
153
-
154
-
155
-
156
-
157
-
158
-
159
-
160
-
161
-
162
-
163
-
164
-
165
-
166
-
167
-
168
-
169
-
170
-
171
-
172
-
173
-
174
-
175
-
176
-
177
-
178
-
179
-
180
-
181
-
182
-
183
-
184
 |
 |

The favorable impact of currency fluctuations increased net operating revenues by approximately 2 percent. The
favorable impact of changes in foreign currency exchange rates was primarily due to a weaker U.S. dollar compared to
certain other foreign currencies, including the Japanese yen, Mexican peso, Brazilian real, South African rand and
Australian dollar, which had a favorable impact on the Eurasia and Africa, Latin America, Pacific and Bottling
Investments operating segments. The favorable impact of a weaker U.S. dollar compared to the aforementioned
currencies was partially offset by the impact of a stronger U.S. dollar compared to certain other foreign currencies,
including the euro and British pound, which had an unfavorable impact on the Europe and Bottling Investments
operating segments. Refer to the heading ‘‘Liquidity, Capital Resources and Financial Position — Foreign Exchange.’’
Year Ended December 31, 2009, versus Year Ended December 31, 2008
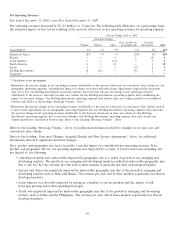
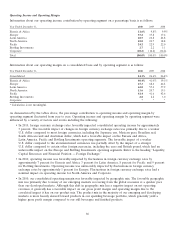
Net operating revenues decreased by $954 million, or 3 percent. The following table illustrates, on a percentage basis,
the estimated impact of key factors resulting in the increase (decrease) in net operating revenues by operating segment:
Percent Change 2009 vs. 2008
Structural Price, product & Currency
Volume1changes geographic mix fluctuations Total
Consolidated 3% (1)% —% (5)% (3)%
Eurasia & Africa 5% —% —% (11)% (6)%
Europe (2) — 1 (9) (10)
Latin America 7 — 9 (15) 1
North America (2) — 2 — —
Pacific 7(1) (7) 54
Bottling Investments 2 (4) 1 (6) (7)
Corporate * * * * *
* Calculation is not meaningful.
1Represents the percent change in net operating revenues attributable to the increase (decrease) in concentrate sales volume for our
geographic operating segments (expressed in equivalent unit cases). For our Bottling Investments operating segment, this represents
the percent change in net operating revenues attributable to the increase (decrease) in unit case volume for the Bottling
Investments operating segment after considering the impact of structural changes. Our Bottling Investments operating segment data
reflects unit case volume growth for consolidated bottlers only. Refer to the heading ‘‘Beverage Volume,’’ above.
Refer to the heading ‘‘Beverage Volume,’’ above, for additional information related to changes in our unit case and
concentrate sales volume.
Structural changes accounted for approximately 1 percent of the decrease in net operating revenues. This decrease was
primarily attributable to the sale of certain bottling operations during 2008, including Remil and a portion of our
ownership interest in Coca-Cola Pakistan, which resulted in its deconsolidation. Refer to the heading ‘‘Operations
Review — Other Income (Loss) — Net’’ and Note 17 of Notes to Consolidated Financial Statements.
Price, product and geographic mix had a net zero percent impact on consolidated net operating revenues. Price, product
and geographic mix for our operating segments was impacted by a variety of factors and events including, but not
limited to, the following:
• consolidated results were unfavorably impacted by shifts in our marketing and media spend strategies. The shift
in our marketing and media spend strategies was primarily due to spending more marketing dollars toward
in-store activations, loyalty points programs and point-of-sale marketing. Many of these strategies impact net
revenues instead of marketing expenses. Refer to the heading ‘‘Selling, General and Administrative Expenses,’’
below;
• consolidated results were unfavorably impacted by geographic mix as a result of growth in our emerging and
developing markets. The growth in our emerging and developing markets resulted in unfavorable geographic mix
due to the fact that the revenue per unit sold in these markets is generally less than in developed markets;
• Latin America benefited from the successful integration of Jugos del Valle. Refer to the heading ‘‘Beverage
Volume,’’ above;
60