BB&T 2008 Annual Report Download - page 102
Download and view the complete annual report
Please find page 102 of the 2008 BB&T annual report below. You can navigate through the pages in the report by either clicking on the pages listed below, or by using the keyword search tool below to find specific information within the annual report.-
 1
1 -
2
-
3
-
4
-
5
-
6
-
7
-
8
-
9
-
10
-
11
-
12
-
13
-
14
-
15
-
16
-
17
-
18
-
19
-
20
-
21
-
22
-
23
-
24
-
25
-
26
-
27
-
28
-
29
-
30
-
31
-
32
-
33
-
34
-
35
-
36
-
37
-
38
-
39
-
40
-
41
-
42
-
43
-
44
-
45
-
46
-
47
-
48
-
49
-
50
-
51
-
52
-
53
-
54
-
55
-
56
-
57
-
58
-
59
-
60
-
61
-
62
-
63
-
64
-
65
-
66
-
67
-
68
-
69
-
70
-
71
-
72
-
73
-
74
-
75
-
76
-
77
-
78
-
79
-
80
-
81
-
82
-
83
-
84
-
85
-
86
-
87
-
88
-
89
-
90
-
91
-
 92
92 -
 93
93 -
 94
94 -
 95
95 -
 96
96 -
 97
97 -
 98
98 -
 99
99 -
 100
100 -
 101
101 -
 102
102 -
 103
103 -
 104
104 -
 105
105 -
 106
106 -
 107
107 -
 108
108 -
 109
109 -
 110
110 -
 111
111 -
 112
112 -
113
-
114
-
115
-
116
-
117
-
118
-
119
-
120
-
121
-
122
-
123
-
124
-
125
-
126
-
127
-
128
-
129
-
130
-
131
-
132
-
133
-
134
-
135
-
136
-
137
-
138
-
139
-
140
-
141
-
142
-
143
-
144
-
145
-
146
-
147
-
148
-
149
-
150
-
151
-
152
 |
 |

BB&T CORPORATION AND SUBSIDIARIES
NOTES TO CONSOLIDATED FINANCIAL STATEMENTS—(Continued)
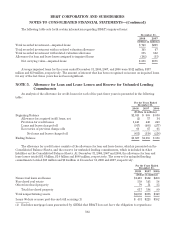
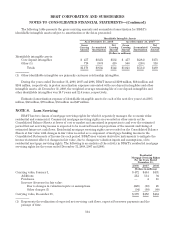
The following table sets forth certain information regarding BB&T’s impaired loans:
December 31,
2008 2007
(Dollars in millions)
Total recorded investment—impaired loans $ 740 $209
Total recorded investment with no related valuation allowance 145 47
Total recorded investment with related valuation allowance 595 162
Allowance for loan and lease losses assigned to impaired loans (102) (33)
Net carrying value—impaired loans $ 638 $176
Average impaired loans for the years ended December 31, 2008, 2007, and 2006 were $512 million, $137
million and $59 million, respectively. The amount of interest that has been recognized as income on impaired loans
for any of the last three years has not been significant.
NOTE 5. Allowance for Loan and Lease Losses and Reserve for Unfunded Lending
Commitments
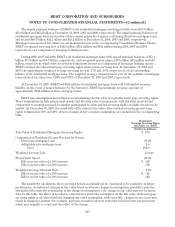
An analysis of the allowance for credit losses for each of the past three years is presented in the following
table:
For the Years Ended
December 31,
2008 2007 2006
(Dollars in millions)
Beginning Balance $1,015 $ 888 $ 830
Allowance for acquired (sold) loans, net (2) 17 34
Provision for credit losses 1,445 448 240
Loans and leases charged-off (917) (405) (277)
Recoveries of previous charge-offs 66 67 61
Net loans and leases charged-off (851) (338) (216)
Ending Balance $1,607 $1,015 $ 888
The allowance for credit losses consists of the allowance for loan and lease losses, which is presented on the
Consolidated Balance Sheets, and the reserve for unfunded lending commitments, which is included in other
liabilities on the Consolidated Balance Sheets. At December 31, 2008, 2007 and 2006, the allowance for loan and
lease losses totaled $1.6 billion, $1.0 billion and $888 million, respectively. The reserve for unfunded lending
commitments totaled $33 million and $11 million at December 31, 2008 and 2007, respectively.
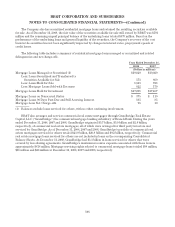
For the Years Ended
December 31,
2008 2007 2006
(Dollars in millions)
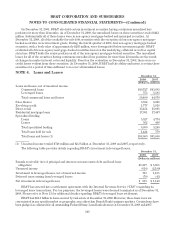
Nonaccrual loans and leases $1,413 $502 $260
Foreclosed real estate 538 143 54
Other foreclosed property 79 51 35
Total foreclosed property 617 194 89
Total nonperforming assets $2,030 $696 $349
Loans 90 days or more past due and still accruing (1) $ 431 $223 $102
(1) Excludes mortgage loans guaranteed by GNMA that BB&T does not have the obligation to repurchase.
102