BB&T 2008 Annual Report Download - page 58
Download and view the complete annual report
Please find page 58 of the 2008 BB&T annual report below. You can navigate through the pages in the report by either clicking on the pages listed below, or by using the keyword search tool below to find specific information within the annual report.-
 1
1 -
2
-
3
-
4
-
5
-
6
-
7
-
8
-
9
-
10
-
11
-
12
-
13
-
14
-
15
-
16
-
17
-
18
-
19
-
20
-
21
-
22
-
23
-
24
-
25
-
26
-
27
-
28
-
29
-
30
-
31
-
32
-
33
-
34
-
35
-
36
-
37
-
38
-
39
-
40
-
41
-
42
-
43
-
44
-
45
-
46
-
47
-
 48
48 -
 49
49 -
 50
50 -
 51
51 -
 52
52 -
 53
53 -
 54
54 -
 55
55 -
 56
56 -
 57
57 -
 58
58 -
 59
59 -
 60
60 -
 61
61 -
 62
62 -
 63
63 -
 64
64 -
 65
65 -
 66
66 -
 67
67 -
 68
68 -
69
-
70
-
71
-
72
-
73
-
74
-
75
-
76
-
77
-
78
-
79
-
80
-
81
-
82
-
83
-
84
-
85
-
86
-
87
-
88
-
89
-
90
-
91
-
92
-
93
-
94
-
95
-
96
-
97
-
98
-
99
-
100
-
101
-
102
-
103
-
104
-
105
-
106
-
107
-
108
-
109
-
110
-
111
-
112
-
113
-
114
-
115
-
116
-
117
-
118
-
119
-
120
-
121
-
122
-
123
-
124
-
125
-
126
-
127
-
128
-
129
-
130
-
131
-
132
-
133
-
134
-
135
-
136
-
137
-
138
-
139
-
140
-
141
-
142
-
143
-
144
-
145
-
146
-
147
-
148
-
149
-
150
-
151
-
152
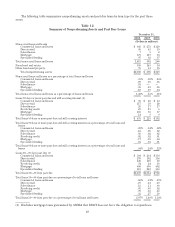
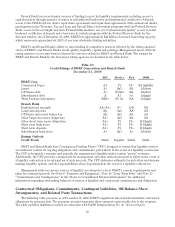
 |
 |

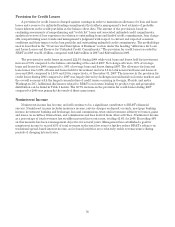
or 13.3%, compared to 2006. The increases in 2008 and 2007 included additional checkcard fees of $21 million and
$25 million, respectively, as clients continued to show a preference for utilizing electronic forms of payment
rather than traditional paper checks. Bankcard fees also grew $12 million in 2008 compared to 2007 and $17
million in 2007 compared to 2006, as a result of strong sales of merchant services.
Trust and investment advisory revenues are based on the types of services provided as well as the overall
value of the assets managed, which is affected by stock market conditions. During 2008, trust and investment
advisory revenues decreased by $15 million, or 9.3%, compared to 2007. During 2007, trust and investment
advisory revenues increased by $8 million, or 5.2%, compared to 2006. The value of trust assets under
management, including custodial accounts, has varied accordingly and was $33.4 billion, $36.9 billion and $33.7
billion at December 31, 2008, 2007 and 2006, respectively.
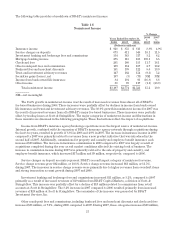
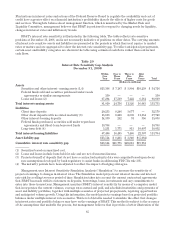
Income from mortgage banking activities includes gains and losses from the sale of mortgage loans, revenue
from servicing mortgage loans, valuation adjustments for mortgage servicing rights, mortgage servicing rights-
related derivative gains/losses and the amortization or realization of expected mortgage servicing rights cash
flows. Mortgage banking income totaled $275 million, $115 million and $108 million during 2008, 2007 and 2006,
respectively. The following table provides a breakdown of the various components of mortgage banking income
and related statistical information:
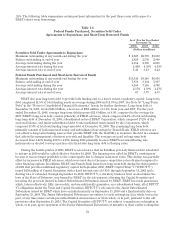
Table 17
Mortgage Banking Income and Related Statistical Information
As of/ For the Years
Ended December 31,
% Change
2008
v.
2007
2007
v.
2006Mortgage Banking Income 2008 2007 2006
(Dollars in millions)
Residential Mortgage Banking:
Residential mortgage production income $ 127 $ 47 $ 46 170.2% 2.2%
Residential Mortgage Servicing:
Residential mortgage servicing fees 145 114 102 27.2 11.8
Residential mortgage servicing rights (decrease) increase in fair value
due to change in valuation inputs or assumptions (220) (60) 21
Mortgage servicing rights hedging gains (losses) 262 64 (17)
Net 42 4 4 NM —
Realization of expected residential mortgage servicing rights cash flows (94) (90) (80) 4.4 12.5
Total residential mortgage servicing income 93 28 26 232.1 7.7
Total residential mortgage banking income 220 75 72 193.3 4.2
Commercial Mortgage Banking:
Commercial mortgage banking revenues 69 46 40 50.0 15.0
Amortization of commercial mortgage servicing rights (14) (6) (4) 133.3 50.0
Total commercial mortgage banking income 55 40 36 37.5 11.1
Total mortgage banking income $ 275 $115 $108 139.1 6.5
As of/ For the Years
Ended December 31,
% Change
2008
v.
2007
2007
v.
2006Mortgage Banking Statistical Information 2008 2007 2006
(Dollars in millions)
Residential mortgage originations $16,438 $11,940 $ 9,889 37.7% 20.7%
Residential mortgage loans serviced for others 40,677 32,093 28,232 26.7 13.7
Residential mortgage loan sales 13,405 7,547 5,282 77.6 42.9
Commercial mortgage originations 3,717 3,012 2,906 23.4 3.6
Commercial mortgage loans serviced for others 23,902 20,752 9,206 15.2 125.4
58