BB&T 2008 Annual Report Download - page 65
Download and view the complete annual report
Please find page 65 of the 2008 BB&T annual report below. You can navigate through the pages in the report by either clicking on the pages listed below, or by using the keyword search tool below to find specific information within the annual report.-
 1
1 -
2
-
3
-
4
-
5
-
6
-
7
-
8
-
9
-
10
-
11
-
12
-
13
-
14
-
15
-
16
-
17
-
18
-
19
-
20
-
21
-
22
-
23
-
24
-
25
-
26
-
27
-
28
-
29
-
30
-
31
-
32
-
33
-
34
-
35
-
36
-
37
-
38
-
39
-
40
-
41
-
42
-
43
-
44
-
45
-
46
-
47
-
48
-
49
-
50
-
51
-
52
-
53
-
54
-
 55
55 -
 56
56 -
 57
57 -
 58
58 -
 59
59 -
 60
60 -
 61
61 -
 62
62 -
 63
63 -
 64
64 -
 65
65 -
 66
66 -
 67
67 -
 68
68 -
 69
69 -
 70
70 -
 71
71 -
 72
72 -
 73
73 -
 74
74 -
 75
75 -
76
-
77
-
78
-
79
-
80
-
81
-
82
-
83
-
84
-
85
-
86
-
87
-
88
-
89
-
90
-
91
-
92
-
93
-
94
-
95
-
96
-
97
-
98
-
99
-
100
-
101
-
102
-
103
-
104
-
105
-
106
-
107
-
108
-
109
-
110
-
111
-
112
-
113
-
114
-
115
-
116
-
117
-
118
-
119
-
120
-
121
-
122
-
123
-
124
-
125
-
126
-
127
-
128
-
129
-
130
-
131
-
132
-
133
-
134
-
135
-
136
-
137
-
138
-
139
-
140
-
141
-
142
-
143
-
144
-
145
-
146
-
147
-
148
-
149
-
150
-
151
-
152
 |
 |

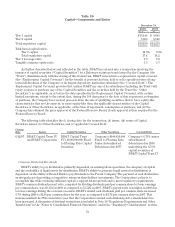
Fluctuations in interest rates and actions of the Federal Reserve Board to regulate the availability and cost of
credit have a greater effect on a financial institution’s profitability than do the effects of higher costs for goods
and services. Through its balance sheet management function, which is monitored by the Market Risk and
Liquidity Committee, management believes that BB&T is positioned to respond to changing needs for liquidity,
changes in interest rates and inflationary trends.
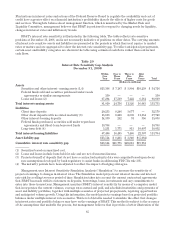
BB&T’s interest rate sensitivity is illustrated in the following table. The table reflects rate-sensitive
positions at December 31, 2008, and is not necessarily indicative of positions on other dates. The carrying amounts
of interest rate sensitive assets and liabilities are presented in the periods in which they next reprice to market
rates or mature and are aggregated to show the interest rate sensitivity gap. To reflect anticipated prepayments,
certain asset and liability categories are shown in the table using estimated cash flows rather than contractual
cash flows.
Table 20
Interest Rate Sensitivity Gap Analysis
December 31, 2008
Within
One
Year
One to
Three
Years
Three to
Five
Years
After
Five
Years Total
(Dollars in millions)
Assets
Securities and other interest- earning assets (1,4) $13,366 $ 7,187 $ 3,904 $10,259 $ 34,716
Federal funds sold and securities purchased under resale
agreements or similar arrangements 350 — — — 350
Loans and leases (2) 67,294 17,569 7,422 6,384 98,669
Total interest-earning assets 81,010 24,756 11,326 16,643 133,735
Liabilities
Client time deposits 20,255 8,246 3,677 — 32,178
Other client deposits with no stated maturity (3) 16,863 6,226 2,805 11,854 37,748
Other interest-bearing deposits 14,339 252 91 356 15,038
Federal funds purchased, securities sold under repurchase
agreements and Short-term borrowed funds 10,788 — — — 10,788
Long-term debt (4) 5,251 1,771 913 10,097 18,032
Total interest-bearing liabilities 67,496 16,495 7,486 22,307 113,784
Asset-liability gap $13,514 $ 8,261 $ 3,840 $ (5,664)
Cumulative interest rate sensitivity gap $13,514 $21,775 $25,615 $19,951
(1) Securities based on amortized cost.
(2) Loans and leases include loans held for sale and are net of unearned income.
(3) Projected runoff of deposits that do not have a contractual maturity date was computed based upon decay
rate assumptions developed by bank regulators to assist banks in addressing FDICIA rule 305.
(4) The maturity periods have been adjusted to reflect the impact of hedging strategies.
Management uses Interest Sensitivity Simulation Analysis (“Simulation”) to measure the sensitivity of
projected earnings to changes in interest rates. The Simulation model projects net interest income and interest
rate risk for a rolling two-year period of time. Simulation takes into account the current contractual agreements
that BB&T has made with its customers on deposits, borrowings, loans, investments and any commitments to
enter into those transactions. Management monitors BB&T’s interest sensitivity by means of a computer model
that incorporates the current volumes, average rates earned and paid, and scheduled maturities and payments of
asset and liability portfolios, together with multiple scenarios of projected prepayments, repricing opportunities
and anticipated volume growth. Using this information, the model projects earnings based on projected portfolio
balances under multiple interest rate scenarios. This level of detail is needed to simulate the effect that changes
in interest rates and portfolio balances may have on the earnings of BB&T. This method is subject to the accuracy
of the assumptions that underlie the process, but management believes that it provides a better illustration of the
65