BB&T 2008 Annual Report Download - page 49
Download and view the complete annual report
Please find page 49 of the 2008 BB&T annual report below. You can navigate through the pages in the report by either clicking on the pages listed below, or by using the keyword search tool below to find specific information within the annual report.-
 1
1 -
2
-
3
-
4
-
5
-
6
-
7
-
8
-
9
-
10
-
11
-
12
-
13
-
14
-
15
-
16
-
17
-
18
-
19
-
20
-
21
-
22
-
23
-
24
-
25
-
26
-
27
-
28
-
29
-
30
-
31
-
32
-
33
-
34
-
35
-
36
-
37
-
38
-
 39
39 -
 40
40 -
 41
41 -
 42
42 -
 43
43 -
 44
44 -
 45
45 -
 46
46 -
 47
47 -
 48
48 -
 49
49 -
 50
50 -
 51
51 -
 52
52 -
 53
53 -
 54
54 -
 55
55 -
 56
56 -
 57
57 -
 58
58 -
 59
59 -
60
-
61
-
62
-
63
-
64
-
65
-
66
-
67
-
68
-
69
-
70
-
71
-
72
-
73
-
74
-
75
-
76
-
77
-
78
-
79
-
80
-
81
-
82
-
83
-
84
-
85
-
86
-
87
-
88
-
89
-
90
-
91
-
92
-
93
-
94
-
95
-
96
-
97
-
98
-
99
-
100
-
101
-
102
-
103
-
104
-
105
-
106
-
107
-
108
-
109
-
110
-
111
-
112
-
113
-
114
-
115
-
116
-
117
-
118
-
119
-
120
-
121
-
122
-
123
-
124
-
125
-
126
-
127
-
128
-
129
-
130
-
131
-
132
-
133
-
134
-
135
-
136
-
137
-
138
-
139
-
140
-
141
-
142
-
143
-
144
-
145
-
146
-
147
-
148
-
149
-
150
-
151
-
152
 |
 |

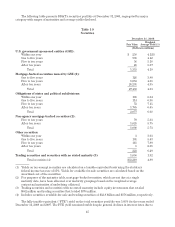
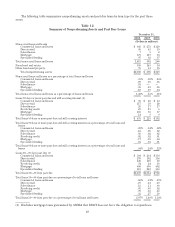
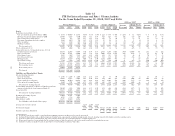
The following table summarizes nonperforming assets and past due loans by loan type for the past three
years.
Table 12
Summary of Nonperforming Assets and Past Due Loans
December 31,
2008 2007 2006
(Dollars in millions)
Nonaccrual loans and leases
Commercial loans and leases $ 845 $ 273 $ 129
Direct retail 89 43 39
Sales finance 752
Mortgage 375 119 53
Specialized lending 97 62 37
Total nonaccrual loans and leases 1,413 502 260
Foreclosed real estate 538 143 54
Other foreclosed property 79 51 35
Total nonperforming assets $2,030 $ 696 $ 349
Nonaccrual loans and leases as a percentage of total loans and leases
Commercial loans and leases .85% .30% .16%
Direct retail .09 .05 .05
Sales finance .01 — —
Mortgage .38 .13 .06
Specialized lending .10 .07 .04
Total nonaccrual loans and leases as a percentage of loans and leases 1.43% .55% .31%
Loans 90 days or more past due and still accruing interest (1)
Commercial loans and leases $ 86 $ 40 $ 14
Direct retail 117 58 20
Sales finance 26 17 17
Revolving credit 23 15 6
Mortgage 165 85 37
Specialized lending 14 8 8
Total loans 90 days or more past due and still accruing interest $ 431 $ 223 $ 102
Total loans 90 days or more past due and still accruing interest as a percentage of total loans and
leases
Commercial loans and leases .09% .04% .02%
Direct retail .12 .06 .02
Sales finance .03 .02 .02
Revolving credit .02 .02 .01
Mortgage .17 .09 .04
Specialized lending .01 .01 .01
Total loans 90 days or more past due and still accruing interest as a percentage of total loans and
leases .44% .24% .12%
Loans 30—89 days past due (1)
Commercial loans and leases $ 594 $ 284 $ 154
Direct retail 270 192 156
Sales finance 146 105 69
Revolving credit 34 24 18
Mortgage 690 506 402
Specialized lending 313 243 153
Total loans 30—89 days past due $2,047 $1,354 $ 952
Total loans 30—89 days past due as a percentage of total loans and leases
Commercial loans and leases .60% .31% .19%
Direct retail .27 .21 .19
Sales finance .15 .11 .08
Revolving credit .03 .03 .02
Mortgage .70 .55 .48
Specialized lending .32 .27 .18
Total loans 30—89 days past due as a percentage of total loans and leases 2.07% 1.48% 1.14%
(1) Excludes mortgage loans guaranteed by GNMA that BB&T does not have the obligation to repurchase.
49