BB&T 2008 Annual Report Download - page 77
Download and view the complete annual report
Please find page 77 of the 2008 BB&T annual report below. You can navigate through the pages in the report by either clicking on the pages listed below, or by using the keyword search tool below to find specific information within the annual report.-
 1
1 -
2
-
3
-
4
-
5
-
6
-
7
-
8
-
9
-
10
-
11
-
12
-
13
-
14
-
15
-
16
-
17
-
18
-
19
-
20
-
21
-
22
-
23
-
24
-
25
-
26
-
27
-
28
-
29
-
30
-
31
-
32
-
33
-
34
-
35
-
36
-
37
-
38
-
39
-
40
-
41
-
42
-
43
-
44
-
45
-
46
-
47
-
48
-
49
-
50
-
51
-
52
-
53
-
54
-
55
-
56
-
57
-
58
-
59
-
60
-
61
-
62
-
63
-
64
-
65
-
66
-
 67
67 -
 68
68 -
 69
69 -
 70
70 -
 71
71 -
 72
72 -
 73
73 -
 74
74 -
 75
75 -
 76
76 -
 77
77 -
 78
78 -
 79
79 -
 80
80 -
 81
81 -
 82
82 -
 83
83 -
 84
84 -
 85
85 -
 86
86 -
 87
87 -
88
-
89
-
90
-
91
-
92
-
93
-
94
-
95
-
96
-
97
-
98
-
99
-
100
-
101
-
102
-
103
-
104
-
105
-
106
-
107
-
108
-
109
-
110
-
111
-
112
-
113
-
114
-
115
-
116
-
117
-
118
-
119
-
120
-
121
-
122
-
123
-
124
-
125
-
126
-
127
-
128
-
129
-
130
-
131
-
132
-
133
-
134
-
135
-
136
-
137
-
138
-
139
-
140
-
141
-
142
-
143
-
144
-
145
-
146
-
147
-
148
-
149
-
150
-
151
-
152
 |
 |
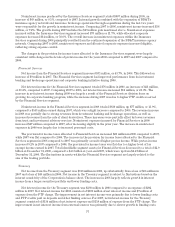
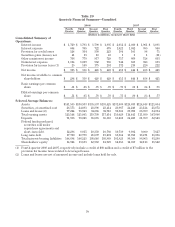
Noninterest income produced by the Insurance Services segment totaled $907 million during 2008, an
increase of $68 million, or 8.1%, compared to 2007. Internal growth combined with the expansion of BB&T’s
insurance agency network and insurance brokerage operations through acquisitions during the last two years
were responsible for the growth in noninterest income. Comparing 2007 to 2006, noninterest income increased $56
million, or 7.2%. The growth during 2007 includes the $19 million gain mentioned above. Noninterest expenses
incurred within the Insurance Services segment increased $73 million or 11.7%, while allocated corporate
expenses increased $14 million, or 50.0%. The overall increase in noninterest expenses within the Insurance
Services segment during 2008 principally resulted from the continued expansion of the BB&T insurance agency
network. Comparing 2007 to 2006, noninterest expenses and allocated corporate expenses increased slightly,
reflecting strong expense control.
The changes in the provision for income taxes allocated to the Insurance Services segment were largely
consistent with changes in the levels of pretax income for the years 2008 compared to 2007 and 2007 compared to
2006.
Financial Services
Net income from the Financial Services segment increased $31 million, or 43.7%, in 2008. This followed an
increase of $9 million in 2007. The Financial Services segment had improved performance from its investment
banking and brokerage operations and corporate banking initiative during 2008.
Net interest income for the Financial Services segment totaled $76 million in 2008, an increase of $21 million,
or 38.2%, compared to 2007. Comparing 2007 to 2006, net interest income increased $11 million, or 25.0%. The
increase in net interest income during 2008 was largely a result of the Financial Services division focus on
growing its corporate banking program, while the increase during 2007 was due to higher FTP credits received
by the Financial Services segment.
Noninterest income in the Financial Services segment in 2008 totaled $630 million, up $77 million, or 13.9%,
compared to $553 million earned during 2007, which was a slight increase compared to 2006. The revenue increase
in 2008 was partially due to strong revenues from investment banking and brokerage operations, as well as
increased revenues from the sale of client derivatives. These increases were partially offset by lower revenues
from trust and investment advisory services. Noninterest expenses incurred by Financial Services in 2008
increased $47 million compared to 2007, after increasing slightly in the prior year. The increase in noninterest
expenses in 2008 was largely due to increased personnel costs.
The provision for income taxes allocated to Financial Services increased $23 million in 2008 compared to 2007,
while 2007 was flat compared to 2006. The increase in the provision for income taxes allocated to the Financial
Services segment in 2008 compared to 2007 was primarily a result of higher pretax income. While pretax income
increased 9.2% in 2007 compared to 2006, the provision for income taxes was flat due to a higher level of tax
exempt income earned in 2007. Total identifiable segment assets for Financial Services decreased to a total of $2.9
billion at December 31, 2008, compared to $4.1 billion at year-end 2007, which were up from $2.2 billion at
December 31, 2006. The fluctuations in assets within the Financial Services segment are largely related to the
size of the trading portfolio.
Treasury
Net income from the Treasury segment was $313 million in 2008, up substantially from a loss of $86 million in
2007 and a loss of $48 million in 2006. Net income in the Treasury segment is subject to fluctuations based on the
interest sensitivity of the Corporation’s balance sheet. The increase in 2008 largely reflects growth in interest
income from a larger securities portfolio and lower funding costs.
Net interest income for the Treasury segment was $293 million in 2008 compared to an expense of $292
million in 2007. Net interest income for 2008 consisted of $300 million of net interest income and $7 million of
expense from the FTP charge. The improvement in net interest income was primarily due to lower funding costs
and FTP credits paid on deposits and other funding sources. For 2007, net interest income for the Treasury
segment consisted of $134 million of net interest expense and $158 million of expense from the FTP charge. The
improvement in net interest income from external sources was primarily due to slower growth in funding costs
77