BB&T 2008 Annual Report Download - page 61
Download and view the complete annual report
Please find page 61 of the 2008 BB&T annual report below. You can navigate through the pages in the report by either clicking on the pages listed below, or by using the keyword search tool below to find specific information within the annual report.-
 1
1 -
2
-
3
-
4
-
5
-
6
-
7
-
8
-
9
-
10
-
11
-
12
-
13
-
14
-
15
-
16
-
17
-
18
-
19
-
20
-
21
-
22
-
23
-
24
-
25
-
26
-
27
-
28
-
29
-
30
-
31
-
32
-
33
-
34
-
35
-
36
-
37
-
38
-
39
-
40
-
41
-
42
-
43
-
44
-
45
-
46
-
47
-
48
-
49
-
50
-
 51
51 -
 52
52 -
 53
53 -
 54
54 -
 55
55 -
 56
56 -
 57
57 -
 58
58 -
 59
59 -
 60
60 -
 61
61 -
 62
62 -
 63
63 -
 64
64 -
 65
65 -
 66
66 -
 67
67 -
 68
68 -
 69
69 -
 70
70 -
 71
71 -
72
-
73
-
74
-
75
-
76
-
77
-
78
-
79
-
80
-
81
-
82
-
83
-
84
-
85
-
86
-
87
-
88
-
89
-
90
-
91
-
92
-
93
-
94
-
95
-
96
-
97
-
98
-
99
-
100
-
101
-
102
-
103
-
104
-
105
-
106
-
107
-
108
-
109
-
110
-
111
-
112
-
113
-
114
-
115
-
116
-
117
-
118
-
119
-
120
-
121
-
122
-
123
-
124
-
125
-
126
-
127
-
128
-
129
-
130
-
131
-
132
-
133
-
134
-
135
-
136
-
137
-
138
-
139
-
140
-
141
-
142
-
143
-
144
-
145
-
146
-
147
-
148
-
149
-
150
-
151
-
152
 |
 |
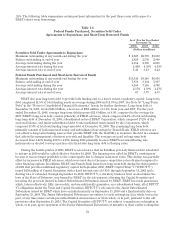
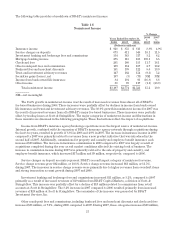
The 7.8% increase in total noninterest expense during 2008 compared to 2007 was primarily due to increases
in personnel costs, professional services and foreclosed property expense. The 3.4% increase in total noninterest
expense during 2007 compared to 2006 reflects strong cost controls. The increases during 2008 and 2007 were
impacted by the acquisitions of AFCO and Coastal during 2007 and several nonbank financial services companies
during 2008 and 2007.
Total personnel expense is the largest component of noninterest expense and includes salaries and wages, as
well as pension and other employee benefit costs. The 2008 increase of 5.1% resulted primarily from additional
salaries and wages as a result of acquisitions and the implementation of the fair value option for loans held for
sale, which changed the accounting for loan origination costs. Total salaries and wages expense increased $148
million, or 8.6%, in 2008 compared to 2007, primarily due to annual salary increases and higher overall headcount.
The increase also includes approximately $55 million related to the change in accounting for loans held for sale as
discussed previously and a decrease in annual incentive compensation. The 10.8% decrease in pension and other
employee benefit costs was driven by a decrease in nonqualified defined contribution expense of $52 million,
which is based on the value of assets in the participant’s accounts. In addition, defined benefit plan expenses were
down $23 million compared to 2007 due to contributions made to the qualified pension plan in 2007 and 2008 that
increased the estimated return on plan assets that is recorded as a component of defined benefit plan expense.
These decreases were partially offset by an increase in health care and other welfare expenses of $20 million
compared to 2007. The 2007 increase of .8% resulted primarily from additional salaries and wages as a result of
acquisitions and an increase in health care expenses. Total salaries and wages expense increased $15 million in
2007 compared to 2006, including higher equity-based compensation, which grew $12 million compared to 2006.
The .5% increase in pension and other employee benefit costs was also affected by the additional salaries and
wages expense, which caused increases in social security taxes and defined contribution plan expenses of $5
million each compared to 2006. In addition, health care and other welfare expenses increased $14 million which
were offset by a decrease in pension expense of $18 million compared to 2006. Additional disclosures relating to
BB&T’s benefit plans can be found in Note 14 “Benefit Plans” in the “Notes to Consolidated Financial
Statements.”
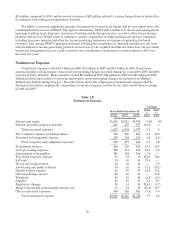
Net occupancy and equipment expense increased $32 million, or 6.7%, in 2008. During 2007, net occupancy
and equipment expense increased by $28 million, or 6.2%. The increases in 2008 and 2007 were largely a result of
increased lease expenses due to BB&T’s de novo branching strategy.
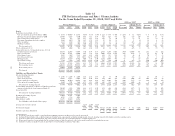
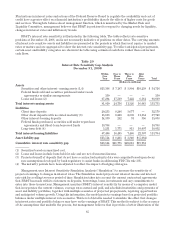
Other noninterest expenses increased $146 million, or 13.7%, compared to 2007, which reflected an increase of
$75 million, or 7.6%, compared to 2006. The 2008 increase was primarily the result of increases in professional
services and foreclosed property expense of $61 million and $48 million, respectively, which are directly related to
the downturn in the residential real estate markets. Regulatory charges, software expenses and loan processing
costs also increased $16 million, $16 million and $14 million, respectively, from the prior year. The 2007 increase
reflected higher professional services, marketing expenses, foreclosed property expenses and loan processing
costs. The increases for 2008 and 2007 were impacted by acquisitions completed during the past two years. Please
refer to Table 18 for additional detail on fluctuations in other categories of noninterest expense.
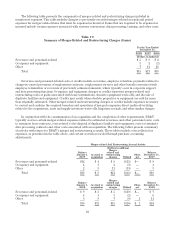
Merger-Related and Restructuring Charges
BB&T recorded certain merger-related and restructuring charges during the years 2008, 2007 and 2006.
These charges are reflected in BB&T’s Consolidated Statements of Income as a category of noninterest expense.
Please Refer to Note 2 “Business Combinations” in the “Notes to Consolidated Financial Statements” for a
summary of mergers and acquisitions consummated during the three years ended December 31, 2008.
The 2008 net merger-related and restructuring charges of $15 million were primarily associated with the
acquisitions of insurance agencies and other merger-related and restructuring activities. During 2007, BB&T
recorded merger-related and restructuring charges of $21 million. These expenses were recorded in connection
with the acquisition of Coastal and other merger-related and restructuring activities. During 2006, BB&T
recorded $18 million of merger-related and restructuring charges. These amounts were primarily associated with
the write-off of duplicate software and systems conversions in connection with the acquisition of Main Street
Banks Inc., which was completed during the year.
61