BB&T 2008 Annual Report Download - page 78
Download and view the complete annual report
Please find page 78 of the 2008 BB&T annual report below. You can navigate through the pages in the report by either clicking on the pages listed below, or by using the keyword search tool below to find specific information within the annual report.-
 1
1 -
2
-
3
-
4
-
5
-
6
-
7
-
8
-
9
-
10
-
11
-
12
-
13
-
14
-
15
-
16
-
17
-
18
-
19
-
20
-
21
-
22
-
23
-
24
-
25
-
26
-
27
-
28
-
29
-
30
-
31
-
32
-
33
-
34
-
35
-
36
-
37
-
38
-
39
-
40
-
41
-
42
-
43
-
44
-
45
-
46
-
47
-
48
-
49
-
50
-
51
-
52
-
53
-
54
-
55
-
56
-
57
-
58
-
59
-
60
-
61
-
62
-
63
-
64
-
65
-
66
-
67
-
 68
68 -
 69
69 -
 70
70 -
 71
71 -
 72
72 -
 73
73 -
 74
74 -
 75
75 -
 76
76 -
 77
77 -
 78
78 -
 79
79 -
 80
80 -
 81
81 -
 82
82 -
 83
83 -
 84
84 -
 85
85 -
 86
86 -
 87
87 -
 88
88 -
89
-
90
-
91
-
92
-
93
-
94
-
95
-
96
-
97
-
98
-
99
-
100
-
101
-
102
-
103
-
104
-
105
-
106
-
107
-
108
-
109
-
110
-
111
-
112
-
113
-
114
-
115
-
116
-
117
-
118
-
119
-
120
-
121
-
122
-
123
-
124
-
125
-
126
-
127
-
128
-
129
-
130
-
131
-
132
-
133
-
134
-
135
-
136
-
137
-
138
-
139
-
140
-
141
-
142
-
143
-
144
-
145
-
146
-
147
-
148
-
149
-
150
-
151
-
152
 |
 |
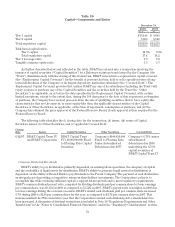
compared to growth in interest income from investments, while the additional FTP charge resulted from higher
credits paid on deposits and other funding sources.
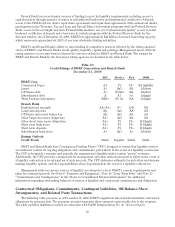
Noninterest income in the Treasury segment is primarily related to BOLI income. During 2008, noninterest
income earned by the Treasury segment totaled $140 million, an increase of 26.1%, compared to $111 million
earned during 2007. The increase in noninterest income during 2008 included certain securities gains that were
retained in the Treasury segment, offset by a decrease from BOLI income due to valuation adjustments recorded
in the 2008. For 2006, noninterest income within the Treasury segment totaled $117 million.
The provision for income taxes allocated to the Treasury segment during 2008 was an expense of $104 million
compared to a benefit of $106 million and $94 million for 2007 and 2006, respectively. The changes in the tax
benefits allocated to the Treasury segment are a combination of changes in the level of pretax income and tax
exempt income. Total identifiable assets for the Treasury segment increased $13.3 billion, or 55.1%, in 2008
compared to 2007, following a slight decrease in 2007 compared to 2006. As of December 31, 2008, total
identifiable assets in the Treasury segment were $37.4 billion. The increase in assets largely reflects the initial
deployment of capital related to the CPP.
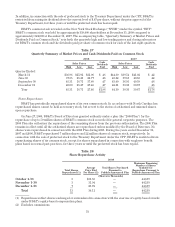
Fourth Quarter Results
Net income for the fourth quarter of 2008 was $305 million, compared to $411 million for the comparable
period of 2007. Net income available to common shareholders for the fourth quarter of 2008 was $284 million.
Diluted net income for the fourth quarter of 2008 was $.51 per common share compared to $.75 for the same
period a year ago. Annualized returns on average assets and average common equity were .86% and 8.47%,
respectively, for the fourth quarter of 2008, compared to 1.24% and 12.89%, respectively, for the fourth quarter of
2007.
Results for the fourth quarter of 2008 include $66 million in after-tax securities gains, $39 million in after-tax
other-than-temporary impairment charges and $17 million in net after tax gains related to a settlement with the
IRS in connection with leveraged lease transactions.
Net interest income amounted to $1.1 billion for the fourth quarter of 2008, an increase of 7.5% compared to
$991 million for the same period of 2007. Noninterest income totaled $807 million for the fourth quarter of 2008,
up 12.4% from $718 million earned during the fourth quarter of 2007. The growth in noninterest income in the
fourth quarter of 2008 compared to the same period of 2007 was driven by increases in mortgage banking income,
investment banking and brokerage operations, net securities gains and insurance income. BB&T’s noninterest
expense for the fourth quarter of 2008 totaled $1.0 billion, up 7.6% from the $942 million recorded in the fourth
quarter of 2007.
The fourth quarter 2008 provision for credit losses increased 187.0% to $528 million, compared to $184 million
for the fourth quarter of 2007. The increase in the provision for credit losses reflects the deteriorating credit
quality of the loan portfolio that has resulted from the distressed residential real estate markets and economic
recession. The increase in the provision for credit losses also reflects higher net charge-offs in the fourth quarter
of 2008, compared to the fourth quarter of 2007.
The fourth quarter 2008 provision for income taxes totaled $25 million, a decrease of $147 million compared to
$172 million for the same period of 2007. The provision for income taxes declined as a result of lower pre-tax
income and a $60 million credit to income tax expense related to BB&T’s settlement with the IRS.
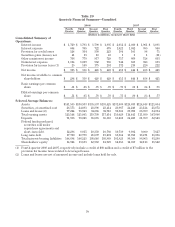
The accompanying table, “Quarterly Financial Summary—Unaudited,” presents condensed information
relating to quarterly periods in the years ended December 31, 2008 and 2007.
78