BB&T 2008 Annual Report Download - page 23
Download and view the complete annual report
Please find page 23 of the 2008 BB&T annual report below. You can navigate through the pages in the report by either clicking on the pages listed below, or by using the keyword search tool below to find specific information within the annual report.-
 1
1 -
2
-
3
-
4
-
5
-
6
-
7
-
8
-
9
-
10
-
11
-
12
-
 13
13 -
 14
14 -
 15
15 -
 16
16 -
 17
17 -
 18
18 -
 19
19 -
 20
20 -
 21
21 -
 22
22 -
 23
23 -
 24
24 -
 25
25 -
 26
26 -
 27
27 -
 28
28 -
 29
29 -
 30
30 -
 31
31 -
 32
32 -
 33
33 -
34
-
35
-
36
-
37
-
38
-
39
-
40
-
41
-
42
-
43
-
44
-
45
-
46
-
47
-
48
-
49
-
50
-
51
-
52
-
53
-
54
-
55
-
56
-
57
-
58
-
59
-
60
-
61
-
62
-
63
-
64
-
65
-
66
-
67
-
68
-
69
-
70
-
71
-
72
-
73
-
74
-
75
-
76
-
77
-
78
-
79
-
80
-
81
-
82
-
83
-
84
-
85
-
86
-
87
-
88
-
89
-
90
-
91
-
92
-
93
-
94
-
95
-
96
-
97
-
98
-
99
-
100
-
101
-
102
-
103
-
104
-
105
-
106
-
107
-
108
-
109
-
110
-
111
-
112
-
113
-
114
-
115
-
116
-
117
-
118
-
119
-
120
-
121
-
122
-
123
-
124
-
125
-
126
-
127
-
128
-
129
-
130
-
131
-
132
-
133
-
134
-
135
-
136
-
137
-
138
-
139
-
140
-
141
-
142
-
143
-
144
-
145
-
146
-
147
-
148
-
149
-
150
-
151
-
152
 |
 |

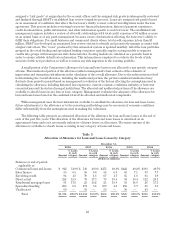
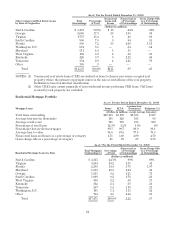
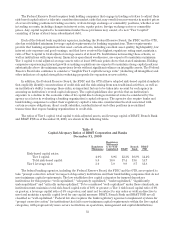
The following tables provide further details regarding BB&T’s commercial real estate lending, residential
mortgage and consumer home equity portfolios as of December 31, 2008.
Table 6
Real Estate Lending Portfolio Credit Quality and Geographic Distribution
Commercial Real Estate Loan Portfolio (1)
As of / For the Period Ended December 31, 2008
Residential Acquisition, Development, and Construction Loans
(ADC) Builder /
Construction Land / Land
Development Condos /
Townhomes Total
ADC
(Dollars in millions, except average loan and average client size)
Total loans outstanding $2,905 $4,533 $ 543 $7,981
Average loan size (in thousands) 296 602 1,280 449
Average client size (in thousands) 851 1,357 3,262 1,149
Percentage of total loans 2.9% 4.6% .6% 8.1%
Nonaccrual loans and leases as a percentage of category 7.87 5.48 4.24 6.27
Gross charge-offs as a percentage of category 1.20 2.07 3.22 1.83
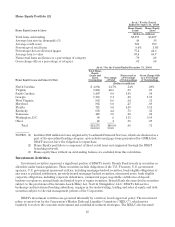
As of / For the Period Ended December 31, 2008
Residential Acquisition, Development, and
Construction Loans (ADC) by State of Origination Total
Outstandings Percentage
of Total
Nonaccrual
Loans and
Leases
Nonaccrual as
a Percentage
of Outstandings
Gross Charge-Offs
as a Percentage
of Outstandings
(Dollars in millions)
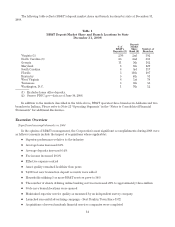
North Carolina $2,926 36.7% $127 4.35% .19%
Georgia 1,364 17.1 133 9.77 5.49
Virginia 1,232 15.4 35 2.82 1.60
Florida 846 10.6 139 16.40 3.17
South Carolina 664 8.3 13 1.96 .25
Tennessee 258 3.2 13 4.94 1.73
Kentucky 224 2.8 28 12.56 .27
Washington, D.C. 219 2.7 6 2.87 3.15
West Virginia 140 1.8 6 4.29 1.01
Maryland 108 1.4 — — 3.81
Total $7,981 100.0% $500 6.27 1.83
As of / For the Period Ended December 31, 2008
Other Commercial Real Estate Loans (2) Commercial
Construction
Commercial
Land /
Development
Permanent
Income
Producing
Properties
Total Other
Commercial
Real Estate
(Dollars in millions, except average loan and average client size)
Total loans outstanding $2,784 $2,607 $6,146 $11,537
Average loan size (in thousands) 1,370 794 360 515
Average client size (in thousands) 1,793 970 538 733
Percentage of total loans 2.8% 2.6% 6.2% 11.7%
Nonaccrual loans and leases as a percentage of category .36 1.99 .80 .97
Gross charge-offs as a percentage of category .15 .64 .13 .25
23