BB&T 2008 Annual Report Download - page 85
Download and view the complete annual report
Please find page 85 of the 2008 BB&T annual report below. You can navigate through the pages in the report by either clicking on the pages listed below, or by using the keyword search tool below to find specific information within the annual report.-
 1
1 -
2
-
3
-
4
-
5
-
6
-
7
-
8
-
9
-
10
-
11
-
12
-
13
-
14
-
15
-
16
-
17
-
18
-
19
-
20
-
21
-
22
-
23
-
24
-
25
-
26
-
27
-
28
-
29
-
30
-
31
-
32
-
33
-
34
-
35
-
36
-
37
-
38
-
39
-
40
-
41
-
42
-
43
-
44
-
45
-
46
-
47
-
48
-
49
-
50
-
51
-
52
-
53
-
54
-
55
-
56
-
57
-
58
-
59
-
60
-
61
-
62
-
63
-
64
-
65
-
66
-
67
-
68
-
69
-
70
-
71
-
72
-
73
-
74
-
 75
75 -
 76
76 -
 77
77 -
 78
78 -
 79
79 -
 80
80 -
 81
81 -
 82
82 -
 83
83 -
 84
84 -
 85
85 -
 86
86 -
 87
87 -
 88
88 -
 89
89 -
 90
90 -
 91
91 -
 92
92 -
 93
93 -
 94
94 -
 95
95 -
96
-
97
-
98
-
99
-
100
-
101
-
102
-
103
-
104
-
105
-
106
-
107
-
108
-
109
-
110
-
111
-
112
-
113
-
114
-
115
-
116
-
117
-
118
-
119
-
120
-
121
-
122
-
123
-
124
-
125
-
126
-
127
-
128
-
129
-
130
-
131
-
132
-
133
-
134
-
135
-
136
-
137
-
138
-
139
-
140
-
141
-
142
-
143
-
144
-
145
-
146
-
147
-
148
-
149
-
150
-
151
-
152
 |
 |

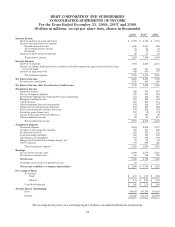
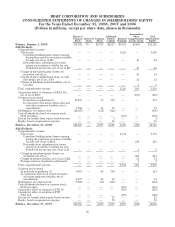
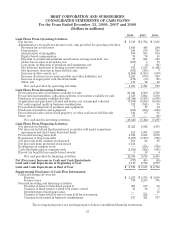
BB&T CORPORATION AND SUBSIDIARIES
CONSOLIDATED STATEMENTS OF CHANGES IN SHAREHOLDERS’ EQUITY
For the Years Ended December 31, 2008, 2007 and 2006
(Dollars in millions, except per share data, shares in thousands)
Shares of
Common
Stock Preferred
Stock Common
Stock
Additional
Paid-In
Capital Retained
Earnings
Accumulated
Other
Comprehensive
Income (Loss)
Total
Shareholders’
Equity
Balance, January 1, 2006 543,102 $— $2,715 $2,819 $5,951 $(356) $11,129
Add (Deduct):
Comprehensive income:
Net income — — — — 1,528 — 1,528
Unrealized holding gains (losses) arising
during the period on securities available
for sale, net of tax of $26 — — — — — 43 43
Reclassification adjustment for losses
(gains) on securities available for sale
included in net income, net of tax of $27 — — — — — 46 46
Change in unrealized gains (losses) on
securities, net of tax — — — — — 89 89
Change in unrecognized gain (loss) on cash
flow hedge, net of tax of $9 — — — — — 13 13
Change in minimum pension liability, net of
tax of $1 — — — — — 3 3
Total comprehensive income — — — — 1,528 105 1,633
Cumulative effect of adoption of SFAS 158,
net of tax of $(68) — — — — (108) (108)
Common stock issued:
In purchase acquisitions (1) 17,488 — 87 670 — — 757
In connection with stock option exercises
and other employee benefits, net of
cancellations 3,192 — 16 75 — — 91
Redemption of common stock (22,307) — (111) (825) — — (936)
Cash dividends declared on common stock,
$1.64 per share — — — — (883) — (883)
Excess tax benefit from equity-based awards — — — 4 — — 4
Equity-based compensation expense — — — 58 — — 58
Balance, December 31, 2006 541,475 — 2,707 2,801 6,596 (359) 11,745
Add (Deduct):
Comprehensive income:
Net income — — — — 1,734 — 1,734
Unrealized holding gains (losses) arising
during the period on securities available
for sale, net of tax of $124 — — — — — 219 219
Reclassification adjustment for losses
(gains) on securities available for sale
included in net income, net of tax of $1 — — — — — 2 2
Change in unrealized gains (losses) on
securities, net of tax — — — — — 221 221
Change in pension liability, net of tax of $22 — — — — — 31 31
Foreign currency translation adjustment — — — — — 3 3
Total comprehensive income — — — — 1,734 255 1,989
Common stock issued:
In purchase acquisitions (1) 9,083 — 46 365 — — 411
In connection with stock option exercises
and other employee benefits, net of
cancellations 2,397 — 12 52 — — 64
Redemption of common stock (7,000) — (35) (219) — — (254)
Cash dividends declared on common stock,
$1.80 per share — — — — (986) — (986)
Cumulative effect of adoption of FIN 48 — — — — (119) — (119)
Cumulative effect of adoption of FSP
FAS 13-2 — — — — (306) — (306)
Excess tax benefit from equity-based awards — — — 18 — 18
Equity-based compensation expense — — — 70 — — 70
Balance, December 31, 2007 545,955 — 2,730 3,087 6,919 (104) 12,632
85