BB&T 2008 Annual Report Download - page 55
Download and view the complete annual report
Please find page 55 of the 2008 BB&T annual report below. You can navigate through the pages in the report by either clicking on the pages listed below, or by using the keyword search tool below to find specific information within the annual report.-
 1
1 -
2
-
3
-
4
-
5
-
6
-
7
-
8
-
9
-
10
-
11
-
12
-
13
-
14
-
15
-
16
-
17
-
18
-
19
-
20
-
21
-
22
-
23
-
24
-
25
-
26
-
27
-
28
-
29
-
30
-
31
-
32
-
33
-
34
-
35
-
36
-
37
-
38
-
39
-
40
-
41
-
42
-
43
-
44
-
 45
45 -
 46
46 -
 47
47 -
 48
48 -
 49
49 -
 50
50 -
 51
51 -
 52
52 -
 53
53 -
 54
54 -
 55
55 -
 56
56 -
 57
57 -
 58
58 -
 59
59 -
 60
60 -
 61
61 -
 62
62 -
 63
63 -
 64
64 -
 65
65 -
66
-
67
-
68
-
69
-
70
-
71
-
72
-
73
-
74
-
75
-
76
-
77
-
78
-
79
-
80
-
81
-
82
-
83
-
84
-
85
-
86
-
87
-
88
-
89
-
90
-
91
-
92
-
93
-
94
-
95
-
96
-
97
-
98
-
99
-
100
-
101
-
102
-
103
-
104
-
105
-
106
-
107
-
108
-
109
-
110
-
111
-
112
-
113
-
114
-
115
-
116
-
117
-
118
-
119
-
120
-
121
-
122
-
123
-
124
-
125
-
126
-
127
-
128
-
129
-
130
-
131
-
132
-
133
-
134
-
135
-
136
-
137
-
138
-
139
-
140
-
141
-
142
-
143
-
144
-
145
-
146
-
147
-
148
-
149
-
150
-
151
-
152
 |
 |

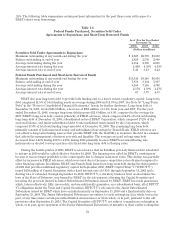
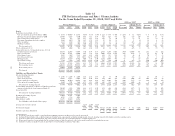
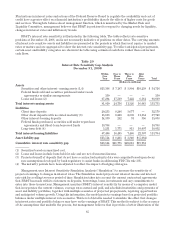
Table 15
FTE Net Interest Income and Rate / Volume Analysis
For the Years Ended December 31, 2008, 2007 and 2006
2008 vs. 2007 2007 vs. 2006
Average Balances Yield / Rate Income / Expense Increase
(Decrease)
Change due to Increase
(Decrease)
Change due to
2008 2007 2006 2008 2007 2006 2008 2007 2006 Rate Volume Rate Volume
(Dollars in millions)
Assets
Securities, at amortized cost (1):
U.S. government sponsored-entities (GSE) $ 4,539 $ 10,099 $ 11,354 4.86% 4.53% 3.96% $ 221 $ 458 $ 449 $ (237) $ 31 $(268) $ 9 $ 62 $ (53)
Mortgage-backed securities issued by GSE 14,708 8,265 6,990 4.94 5.15 4.97 727 425 347 302 (18) 320 78 13 65
States and political subdivisions 1,841 873 607 6.33 6.65 6.89 116 58 42 58 (3) 61 16 (1) 17
Non-agency mortgage-backed securities 1,642 1,669 706 5.81 5.78 5.45 95 96 38 (1) 1 (2) 58 2 56
Other securities 1,138 1,182 829 4.72 7.04 6.11 54 83 51 (29) (25) (4) 32 9 23
Trading securities 629 1,223 862 3.80 4.62 3.34 24 57 29 (33) (9) (24) 28 13 15
Total securities (5) 24,497 23,311 21,348 5.05 5.05 4.48 1,237 1,177 956 60 (23) 83 221 98 123
Other earning assets (2) 1,160 1,042 911 2.43 4.88 5.69 28 51 52 (23) (29) 6 (1) (9) 8
Loans and leases, net of unearned income (1)(3)(4)
Commercial loans and leases 47,559 42,475 38,966 5.50 7.76 7.78 2,617 3,296 3,033 (679) (1,040) 361 263 (9) 272
Direct retail loans 15,580 15,471 14,904 6.47 7.36 7.19 1,008 1,139 1,072 (131) (139) 8 67 26 41
Sales finance loans 6,216 5,903 5,385 6.62 6.66 6.01 412 393 323 19 (2) 21 70 37 33
Revolving credit loans 1,664 1,460 1,331 10.95 12.97 12.60 182 189 168 (7) (32) 25 21 5 16
Mortgage loans 18,577 17,489 15,482 6.00 5.99 5.70 1,114 1,048 883 66 1 65 165 47 118
Specialized lending 5,599 5,154 3,245 12.78 13.27 15.22 715 684 494 31 (27) 58 190 (70) 260
Total loans and leases 95,195 87,952 79,313 6.35 7.67 7.53 6,048 6,749 5,973 (701) (1,239) 538 776 36 740
Total earning assets 120,852 112,305 101,572 6.05 7.10 6.87 7,313 7,977 6,981 (664) (1,291) 627 996 125 871
Non-earning assets 16,029 14,115 12,756
Total assets $136,881 $126,420 $114,328
Liabilities and Shareholders’ Equity
Interest-bearing deposits:
Interest-checking $ 2,376 $ 2,297 $ 2,164 1.19 2.31 1.87 28 53 40 (25) (27) 2 13 10 3
Other client deposits 36,676 34,273 31,462 1.67 2.82 2.43 612 968 764 (356) (420) 64 204 132 72
Client certificates of deposits 26,908 26,039 22,564 3.66 4.61 4.16 985 1,201 939 (216) (255) 39 262 108 154
Other interest-bearing deposits 9,810 7,741 7,822 2.71 5.15 5.04 266 398 394 (132) (220) 88 4 8 (4)
Total interest-bearing deposits 75,770 70,350 64,012 2.50 3.73 3.34 1,891 2,620 2,137 (729) (922) 193 483 258 225
Federal funds purchased, securities sold under repurchase
agreements and short-term borrowed funds (1) 10,580 9,325 7,006 2.44 4.55 4.30 258 424 301 (166) (217) 51 123 18 105
Long-term debt 19,839 18,045 14,628 4.25 5.46 5.10 843 985 747 (142) (233) 91 238 56 182
Total interest-bearing liabilities 106,189 97,720 85,646 2.82 4.12 3.72 2,992 4,029 3,185 (1,037) (1,372) 335 844 332 512
Noninterest-bearing deposits 13,061 13,151 13,218
Other liabilities 4,136 3,383 4,012
Shareholders’ equity 13,495 12,166 11,452
Total liabilities and shareholders’ equity $136,881 $126,420 $114,328
Average interest rate spread 3.23% 2.98% 3.15%
Net interest margin 3.58% 3.52% 3.74% $4,321 $3,948 $3,796 $ 373 $ 81 $ 292 $152 $(207) $359
Taxable equivalent adjustment $83$68$88
(1) Yields are stated on a taxable equivalent basis assuming tax rates in effect for the periods presented.
(2) Includes Federal funds sold, securities purchased under resale agreements or similar arrangements, interest-bearing deposits with banks, and other earning assets.
(3) Loan fees, which are not material for any of the periods shown, have been included for rate calculation purposes.
(4) Nonaccrual loans have been included in the average balances. Only the interest collected on such loans has been included as income.
(5) Includes securties available for sale at amortized cost and trading securities at fair value.
55