BB&T 2008 Annual Report Download - page 17
Download and view the complete annual report
Please find page 17 of the 2008 BB&T annual report below. You can navigate through the pages in the report by either clicking on the pages listed below, or by using the keyword search tool below to find specific information within the annual report.-
 1
1 -
2
-
3
-
4
-
5
-
6
-
 7
7 -
 8
8 -
 9
9 -
 10
10 -
 11
11 -
 12
12 -
 13
13 -
 14
14 -
 15
15 -
 16
16 -
 17
17 -
 18
18 -
 19
19 -
 20
20 -
 21
21 -
 22
22 -
 23
23 -
 24
24 -
 25
25 -
 26
26 -
 27
27 -
28
-
29
-
30
-
31
-
32
-
33
-
34
-
35
-
36
-
37
-
38
-
39
-
40
-
41
-
42
-
43
-
44
-
45
-
46
-
47
-
48
-
49
-
50
-
51
-
52
-
53
-
54
-
55
-
56
-
57
-
58
-
59
-
60
-
61
-
62
-
63
-
64
-
65
-
66
-
67
-
68
-
69
-
70
-
71
-
72
-
73
-
74
-
75
-
76
-
77
-
78
-
79
-
80
-
81
-
82
-
83
-
84
-
85
-
86
-
87
-
88
-
89
-
90
-
91
-
92
-
93
-
94
-
95
-
96
-
97
-
98
-
99
-
100
-
101
-
102
-
103
-
104
-
105
-
106
-
107
-
108
-
109
-
110
-
111
-
112
-
113
-
114
-
115
-
116
-
117
-
118
-
119
-
120
-
121
-
122
-
123
-
124
-
125
-
126
-
127
-
128
-
129
-
130
-
131
-
132
-
133
-
134
-
135
-
136
-
137
-
138
-
139
-
140
-
141
-
142
-
143
-
144
-
145
-
146
-
147
-
148
-
149
-
150
-
151
-
152
 |
 |

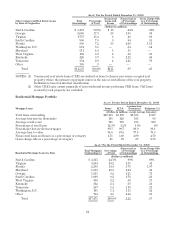
The following table summarizes BB&T’s loan portfolio based on the regulatory classification of the portfolio,
which focuses on the underlying loan collateral, and differs from internal classifications presented herein that
focus on the primary purpose of the loan.
Table 2
Composition of Loan and Lease Portfolio
December 31,
2008 2007 2006 2005 2004
(Dollars in millions)
Commercial, financial and agricultural loans $17,131 $14,037 $10,848 $ 9,532 $ 8,824
Lease receivables 2,007 3,899 4,358 4,250 4,170
Real estate—construction and land development loans 20,065 19,474 17,553 11,942 8,601
Real estate—mortgage loans 46,772 44,687 42,219 41,539 39,257
Consumer loans 12,018 11,107 10,389 9,604 9,238
Total loans and leases held for investment 97,993 93,204 85,367 76,867 70,090
Less: unearned income (748) (2,297) (2,456) (2,473) (2,540)
Net loans and leases held for investment 97,245 90,907 82,911 74,394 67,550
Loans held for sale 1,424 779 680 629 613
Total loans and leases $98,669 $91,686 $83,591 $75,023 $68,163
BB&T’s loan portfolio is approximately 50% commercial and 50% retail by design, and is divided into six
major categories—commercial, sales finance, revolving credit, direct retail, mortgage and specialized lending.
BB&T lends to a diverse customer base that is substantially located within the Corporation’s primary market
area. At the same time, the loan portfolio is geographically dispersed throughout BB&T’s branch network to
mitigate concentration risk arising from local and regional economic downturns.
The following discussion presents the principal types of lending conducted by BB&T and describes the
underwriting procedures and overall risk management of BB&T’s lending function. The relative risk of each loan
portfolio is presented in the “Asset Quality” section of “Management’s Discussion and Analysis of Financial
Condition and Results of Operations” herein.
Underwriting Approach
Recognizing that the loan portfolio is a primary source of profitability, proper loan underwriting is critical to
BB&T’s long-term financial success. BB&T’s underwriting approach is designed to define acceptable
combinations of specific risk-mitigating features that ensure credit relationships conform to BB&T’s risk
philosophy. Provided below is a summary of the most significant underwriting criteria used to evaluate new loans
and loan renewals:
ŠCash flow and debt service coverage—cash flow adequacy is a necessary condition of creditworthiness,
meaning that loans not clearly supported by a borrower’s cash flow must be justified by secondary
repayment sources.
ŠSecondary sources of repayment—alternative repayment funds are a significant risk-mitigating factor as
long as they are liquid, can be easily accessed and provide adequate resources to supplement the primary
cash flow source.
ŠValue of any underlying collateral—loans are generally secured by the asset being financed. Because an
analysis of the primary and secondary sources of repayment is the most important factor, collateral,
unless it is liquid, does not justify loans that cannot be serviced by the borrower’s normal cash flows.
ŠOverall creditworthiness of the customer, taking into account the customer’s relationships, both past and
current, with other lenders—our success depends on building lasting and mutually beneficial relationships
with clients, which involves assessing their financial position and background.
ŠLevel of equity invested in the transaction—in general, borrowers are required to contribute or invest a
portion of their own funds prior to any loan advances.
17