BB&T 2008 Annual Report Download - page 57
Download and view the complete annual report
Please find page 57 of the 2008 BB&T annual report below. You can navigate through the pages in the report by either clicking on the pages listed below, or by using the keyword search tool below to find specific information within the annual report.-
 1
1 -
2
-
3
-
4
-
5
-
6
-
7
-
8
-
9
-
10
-
11
-
12
-
13
-
14
-
15
-
16
-
17
-
18
-
19
-
20
-
21
-
22
-
23
-
24
-
25
-
26
-
27
-
28
-
29
-
30
-
31
-
32
-
33
-
34
-
35
-
36
-
37
-
38
-
39
-
40
-
41
-
42
-
43
-
44
-
45
-
46
-
 47
47 -
 48
48 -
 49
49 -
 50
50 -
 51
51 -
 52
52 -
 53
53 -
 54
54 -
 55
55 -
 56
56 -
 57
57 -
 58
58 -
 59
59 -
 60
60 -
 61
61 -
 62
62 -
 63
63 -
 64
64 -
 65
65 -
 66
66 -
 67
67 -
68
-
69
-
70
-
71
-
72
-
73
-
74
-
75
-
76
-
77
-
78
-
79
-
80
-
81
-
82
-
83
-
84
-
85
-
86
-
87
-
88
-
89
-
90
-
91
-
92
-
93
-
94
-
95
-
96
-
97
-
98
-
99
-
100
-
101
-
102
-
103
-
104
-
105
-
106
-
107
-
108
-
109
-
110
-
111
-
112
-
113
-
114
-
115
-
116
-
117
-
118
-
119
-
120
-
121
-
122
-
123
-
124
-
125
-
126
-
127
-
128
-
129
-
130
-
131
-
132
-
133
-
134
-
135
-
136
-
137
-
138
-
139
-
140
-
141
-
142
-
143
-
144
-
145
-
146
-
147
-
148
-
149
-
150
-
151
-
152
 |
 |

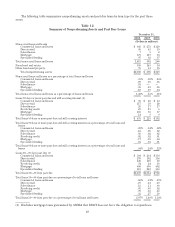
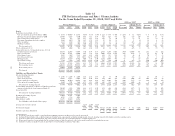
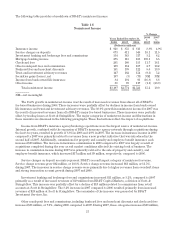
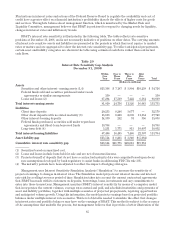
The following table provides a breakdown of BB&T’s noninterest income:
Table 16
Noninterest Income
Years Ended December 31,
% Change
2008
v.
2007
2007
v.
20062008 2007 2006
(Dollars in millions)
Insurance income $ 928 $ 853 $ 813 8.8% 4.9%
Service charges on deposits 673 611 548 10.1 11.5
Investment banking and brokerage fees and commissions 354 343 317 3.2 8.2
Mortgage banking income 275 115 108 139.1 6.5
Checkcard fees 201 180 155 11.7 16.1
Other nondeposit fees and commissions 189 184 167 2.7 10.2
Bankcard fees and merchant discounts 151 139 122 8.6 13.9
Trust and investment advisory revenues 147 162 154 (9.3) 5.2
Securities gains (losses), net 107 (3) (73) NM NM
Income from bank-owned life insurance 84 101 93 (16.8) 8.6
Other income 88 89 117 (1.1) (23.9)
Total noninterest income $3,197 $2,774 $2,521 15.2 10.0
NM—not meaningful
The 15.2% growth in noninterest income was the result of increased revenues from almost all of BB&T’s
fee-based businesses during 2008. These increases were partially offset by declines in income from bank-owned
life insurance and trust and investment advisory revenues. The 10.0% growth in noninterest income for 2007 was
the result of increased revenues from all of BB&T’s major fee-based businesses. These increases were partially
offset by trading losses at Scott & Stringfellow. The major categories of noninterest income and fluctuations in
these amounts are discussed in the following paragraphs. These fluctuations reflect the impact of acquisitions.
Income from BB&T’s insurance agency/brokerage operations were the largest source of noninterest income.
Internal growth, combined with the expansion of BB&T’s insurance agency network through acquisitions during
the last two years, resulted in growth of 8.8% in 2008 and 4.9% in 2007. The increase in insurance income in 2008
compared to 2007 was primarily related to revenues from a new product initiative that was introduced in the
second half of 2007. Additionally, commissions for property and casualty and employee benefit insurance each
increased $19 million. The increase in insurance commissions in 2008 compared to 2007 was largely a result of
acquisitions completed during the year as soft market conditions affected the existing book of business. The
increase in commission income during 2007 was primarily related to the sale of property and casualty, and
employee benefit insurance, which increased $17 million and $9 million, respectively, compared to 2006.
Service charges on deposit accounts represent BB&T’s second largest category of noninterest revenue.
Service charge revenue grew $62 million, or 10.1%. Service charge revenue increased $63 million, or 11.5%,
during 2007. The increases in service charge revenue were primarily due to higher revenues from overdraft items
and strong transaction account growth during 2007 and 2008.
Investment banking and brokerage fees and commissions increased $11 million, or 3.2%, compared to 2007
primarily as a result of increased revenues of $19 million from BB&T Capital Markets, a division of Scott &
Stringfellow. This increase was partially offset by a decline of $13 million related to commissions from retail
accounts at Scott & Stringfellow. The 8.2% increase in 2007 compared to 2006 resulted primarily from increased
revenues of $20 million at Scott & Stringfellow. The remainder of the increase was generated by BB&T
Investment Services, Inc.
Other nondeposit fees and commissions, including bankcard fees and merchant discounts and checkcard fees
increased $38 million, or 7.6%, during 2008 compared to 2007. During 2007, these categories increased $59 million,
57