BB&T 2008 Annual Report Download - page 75
Download and view the complete annual report
Please find page 75 of the 2008 BB&T annual report below. You can navigate through the pages in the report by either clicking on the pages listed below, or by using the keyword search tool below to find specific information within the annual report.-
 1
1 -
2
-
3
-
4
-
5
-
6
-
7
-
8
-
9
-
10
-
11
-
12
-
13
-
14
-
15
-
16
-
17
-
18
-
19
-
20
-
21
-
22
-
23
-
24
-
25
-
26
-
27
-
28
-
29
-
30
-
31
-
32
-
33
-
34
-
35
-
36
-
37
-
38
-
39
-
40
-
41
-
42
-
43
-
44
-
45
-
46
-
47
-
48
-
49
-
50
-
51
-
52
-
53
-
54
-
55
-
56
-
57
-
58
-
59
-
60
-
61
-
62
-
63
-
64
-
 65
65 -
 66
66 -
 67
67 -
 68
68 -
 69
69 -
 70
70 -
 71
71 -
 72
72 -
 73
73 -
 74
74 -
 75
75 -
 76
76 -
 77
77 -
 78
78 -
 79
79 -
 80
80 -
 81
81 -
 82
82 -
 83
83 -
 84
84 -
 85
85 -
86
-
87
-
88
-
89
-
90
-
91
-
92
-
93
-
94
-
95
-
96
-
97
-
98
-
99
-
100
-
101
-
102
-
103
-
104
-
105
-
106
-
107
-
108
-
109
-
110
-
111
-
112
-
113
-
114
-
115
-
116
-
117
-
118
-
119
-
120
-
121
-
122
-
123
-
124
-
125
-
126
-
127
-
128
-
129
-
130
-
131
-
132
-
133
-
134
-
135
-
136
-
137
-
138
-
139
-
140
-
141
-
142
-
143
-
144
-
145
-
146
-
147
-
148
-
149
-
150
-
151
-
152
 |
 |
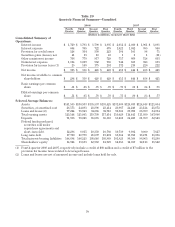
The provision for income taxes allocated to the Banking Network decreased $341 million in 2008 compared to
2007, primarily as a result of lower pretax income. Comparing 2007 to 2006, the provision for income taxes
increased $48 million, or 5.5%, primarily as a result of higher pretax income.
Total identifiable assets for the Banking Network increased $4.6 billion in 2008, or 7.6%, to a total of $65.4
billion, compared to an increase of $4.1 billion, or 7.2%, in 2007. The increase in 2008 included the acquisition of
Haven Trust, while the 2007 increase included the acquisition of Coastal.
Residential Mortgage Banking
BB&T’s mortgage originations totaled $16.4 billion in 2008, up 37.7% from $11.9 billion in 2007. BB&T’s
residential mortgage servicing portfolio, which includes portfolio loans on BB&T’s balance sheet and loans
serviced for third parties, totaled $59.7 billion at year-end 2008 compared to $51.0 billion at December 31, 2007.
Net income attributable to the Residential Mortgage Banking segment increased slightly in 2008, as strong
growth in noninterest income was offset by an increase in the economic provision for loan loss. 2008 results in the
Residential Mortgage Banking segment were also aided by the implementation of the Fair Value Option for loans
held for sale on January 1, 2008.
Net interest income for the Residential Mortgage Banking segment totaled $300 million in 2008, up 19.5%
compared to $251 million in 2007. Net interest income in 2007 was up 1.6% compared to 2006. The increase in net
interest income in 2008 and 2007 was primarily the result of growth in the held for investment loan portfolio,
offset by higher funding costs.
The economic provision for loan and lease losses was $134 million for 2008, up significantly compared to 2007.
The growth in the provision reflected higher losses in 2008 and the significant deterioration in residential real
estate markets, especially in Florida, Georgia and metro Washington D.C.
Noninterest income in the Residential Mortgage Banking segment increased $104 million in 2008. This
increase includes the impact of the implementation of the Fair Value Option for loans held for sale, which resulted
in an increase of approximately $21 million in noninterest income when compared to 2007. The remaining variance
included a $38 million increase in the net mortgage servicing rights valuation and growth in servicing fees.
Noninterest income was up $11 million in 2007 compared to 2006, primarily reflecting higher gains from loan
sales. Noninterest expenses incurred within the Residential Mortgage Banking segment increased $20 million, or
31.3%, compared to 2007, reflecting higher salaries and wages and foreclosed property expense. Noninterest
expense for 2007 was up $11 million, or 20.8%, during 2007, primarily reflecting higher personnel costs.
Total identifiable assets for the Residential Mortgage Banking segment increased $525 million, or 2.8%, from
2007 and $2.1 billion, or 12.6%, from 2007 to 2006, reflecting increases in mortgage loans due to growth in
originations in 2008 and 2007 and improved loan retention due to historically slow prepayments in 2008 and 2007.
Sales Finance
Net income from the Sales Finance segment decreased $16 million, or 47.1%, in 2008 compared to 2007,
reflecting higher provision for loan loss expenses. Net income for 2007 was up slightly compared to 2006.
Net interest income from the Sales Finance segment decreased slightly during 2008 compared to 2007. The
decrease in net interest income during 2008 included an increase of $25 million, or 6.6%, from clients, and an
increase in the FTP charge of $27 million, or 10.5%. During 2007, net interest income increased $8 million, or 7.1%,
compared to 2006. The decrease in net interest income during 2007 included an increase of $70 million, or 22.9%,
from clients, and an increase in the FTP charge of $62 million, or 32.0%.
The economic provision for loan and lease losses was up 90.5% in 2008 after being flat in 2007. The increase in
2008 reflects higher loss rates and the current weak economic conditions.
75