BB&T 2008 Annual Report Download - page 53
Download and view the complete annual report
Please find page 53 of the 2008 BB&T annual report below. You can navigate through the pages in the report by either clicking on the pages listed below, or by using the keyword search tool below to find specific information within the annual report.-
 1
1 -
2
-
3
-
4
-
5
-
6
-
7
-
8
-
9
-
10
-
11
-
12
-
13
-
14
-
15
-
16
-
17
-
18
-
19
-
20
-
21
-
22
-
23
-
24
-
25
-
26
-
27
-
28
-
29
-
30
-
31
-
32
-
33
-
34
-
35
-
36
-
37
-
38
-
39
-
40
-
41
-
42
-
 43
43 -
 44
44 -
 45
45 -
 46
46 -
 47
47 -
 48
48 -
 49
49 -
 50
50 -
 51
51 -
 52
52 -
 53
53 -
 54
54 -
 55
55 -
 56
56 -
 57
57 -
 58
58 -
 59
59 -
 60
60 -
 61
61 -
 62
62 -
 63
63 -
64
-
65
-
66
-
67
-
68
-
69
-
70
-
71
-
72
-
73
-
74
-
75
-
76
-
77
-
78
-
79
-
80
-
81
-
82
-
83
-
84
-
85
-
86
-
87
-
88
-
89
-
90
-
91
-
92
-
93
-
94
-
95
-
96
-
97
-
98
-
99
-
100
-
101
-
102
-
103
-
104
-
105
-
106
-
107
-
108
-
109
-
110
-
111
-
112
-
113
-
114
-
115
-
116
-
117
-
118
-
119
-
120
-
121
-
122
-
123
-
124
-
125
-
126
-
127
-
128
-
129
-
130
-
131
-
132
-
133
-
134
-
135
-
136
-
137
-
138
-
139
-
140
-
141
-
142
-
143
-
144
-
145
-
146
-
147
-
148
-
149
-
150
-
151
-
152
 |
 |
Liquidity needs are a primary consideration in evaluating funding sources. BB&T’s strategy is to maintain
funding flexibility in order that the Corporation may react rapidly to opportunities that may become available in
the marketplace. BB&T will continue to focus on traditional core funding strategies, supplemented as needed by
the types of borrowings discussed above. See “Liquidity” herein for additional discussion.
Shareholders’ Equity
Shareholders’ equity totaled $16.0 billion at December 31, 2008, an increase of $3.4 billion, or 27.0%, from
year-end 2007. This increase reflects the $3.1 billion of capital invested by the U.S. Treasury in the fourth quarter
of 2008. In addition, during 2008, BB&T issued 13.3 million common shares of stock in connection with business
combinations, equity-based incentive plans, the Company’s dividend reinvestment plan and a private placement
of shares sold to the Company’s pension plan. These transactions increased shareholders’ equity by $357 million.
Additionally, growth of $491 million in shareholders’ equity resulted from BB&T’s earnings retained after
dividends to common shareholders. This growth was partially offset by a decrease to shareholders’ equity of $628
million from other comprehensive income, which principally relates to decreases in the fair values of
available-for-sale securities and pension assets.
Analysis of Results of Operations
Consolidated net income for 2008 totaled $1.52 billion. Net income available to common shareholders totaled
$1.50 billion, which generated basic earnings per common share of $2.73 and diluted earnings per common share of
$2.71. Net income for 2007 was $1.73 billion and net income for 2006 totaled $1.53 billion. Basic earnings per
common share were $3.17 in 2007 and $2.84 in 2006, while diluted earnings per common share were $3.14 and
$2.81 for 2007 and 2006, respectively.
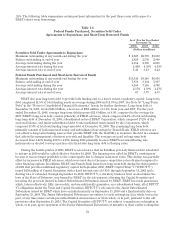
Two important and commonly used measures of bank profitability are return on average assets (net income
as a percentage of average total assets) and return on average common shareholders’ equity (net income available
to common shareholders as a percentage of average common shareholders’ equity). BB&T’s returns on average
assets were 1.11%, 1.37%, and 1.34% for the years ended December 31, 2008, 2007 and 2006, respectively. The
returns on average common shareholders’ equity were 11.44%, 14.25%, and 13.35% for the last three years.
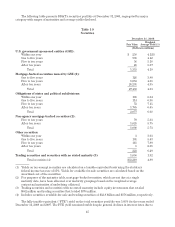
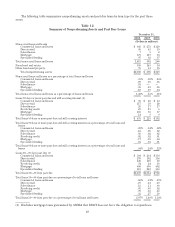
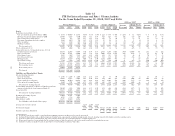
Net Interest Income
Net interest income is BB&T’s primary source of revenue. Net interest income is influenced by a number of
factors, including the volume, mix and maturity of interest-earning assets and interest-bearing liabilities and the
interest rates earned and paid thereon. The difference between rates earned on interest-earning assets and the
cost of the supporting funds (with an adjustment made to tax-exempt items to provide comparability with taxable
items, i.e. the “FTE” adjustment) is measured by the net interest margin. The accompanying table presents the
dollar amount of changes in interest income and interest expense, and distinguishes between the changes related
to increases or decreases in average outstanding balances of interest-earning assets and interest-bearing
liabilities (volume), and the changes related to increases or decreases in average interest rates on such assets and
liabilities (rate). Changes attributable to both volume and rate have been allocated proportionately.
For 2008, net interest income on an FTE-adjusted basis totaled $4.3 billion, compared with $3.9 billion in 2007
and $3.8 billion in 2006. Net interest income increased 9.4% in 2008 compared to 2007. The increase in net interest
income during 2008 resulted primarily from liability costs repricing more quickly as short-term rates declined
throughout the year. Net interest income increased 4.0% in 2007 compared to 2006, as the benefit from strong
average earning asset growth of 10.6% was partially offset by the adverse impact from higher short-term rates in
2007 compared to 2006, which caused funding costs to increase at a faster pace than interest on earning assets.
The FTE-adjusted net interest margin is the primary measure used in evaluating the gross profit margin
from the portfolios of earning assets. The FTE-adjusted net interest margin was 3.58% in 2008, 3.52% in 2007 and
3.74% in 2006. The average yield on interest earning assets decreased 105 basis points compared to the average
yield during 2007, while the average cost of funds over the same time period decreased 130 basis points. The
Federal Reserve Board began lowering rates in September 2007 and lowered short-term rates by 100 basis points
in the last four months of 2007 and an additional 400 basis points during 2008. While many of BB&T’s liabilities
53