BB&T 2008 Annual Report Download - page 20
Download and view the complete annual report
Please find page 20 of the 2008 BB&T annual report below. You can navigate through the pages in the report by either clicking on the pages listed below, or by using the keyword search tool below to find specific information within the annual report.-
 1
1 -
2
-
3
-
4
-
5
-
6
-
7
-
8
-
9
-
 10
10 -
 11
11 -
 12
12 -
 13
13 -
 14
14 -
 15
15 -
 16
16 -
 17
17 -
 18
18 -
 19
19 -
 20
20 -
 21
21 -
 22
22 -
 23
23 -
 24
24 -
 25
25 -
 26
26 -
 27
27 -
 28
28 -
 29
29 -
 30
30 -
31
-
32
-
33
-
34
-
35
-
36
-
37
-
38
-
39
-
40
-
41
-
42
-
43
-
44
-
45
-
46
-
47
-
48
-
49
-
50
-
51
-
52
-
53
-
54
-
55
-
56
-
57
-
58
-
59
-
60
-
61
-
62
-
63
-
64
-
65
-
66
-
67
-
68
-
69
-
70
-
71
-
72
-
73
-
74
-
75
-
76
-
77
-
78
-
79
-
80
-
81
-
82
-
83
-
84
-
85
-
86
-
87
-
88
-
89
-
90
-
91
-
92
-
93
-
94
-
95
-
96
-
97
-
98
-
99
-
100
-
101
-
102
-
103
-
104
-
105
-
106
-
107
-
108
-
109
-
110
-
111
-
112
-
113
-
114
-
115
-
116
-
117
-
118
-
119
-
120
-
121
-
122
-
123
-
124
-
125
-
126
-
127
-
128
-
129
-
130
-
131
-
132
-
133
-
134
-
135
-
136
-
137
-
138
-
139
-
140
-
141
-
142
-
143
-
144
-
145
-
146
-
147
-
148
-
149
-
150
-
151
-
152
 |
 |

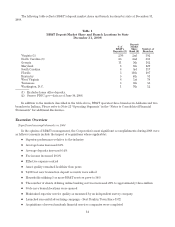
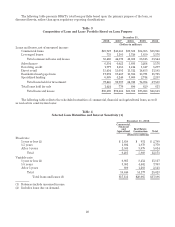
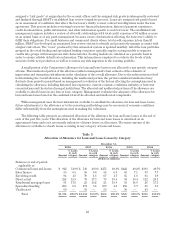
The following table presents BB&T’s total loan portfolio based upon the primary purpose of the loan, as
discussed herein, rather than upon regulatory reporting classifications:
Table 3
Composition of Loan and Lease Portfolio Based on Loan Purpose
December 31,
2008 2007 2006 2005 2004
(Dollars in millions)
Loans and leases, net of unearned income:
Commercial loans $49,727 $43,685 $39,580 $34,965 $31,968
Leveraged leases 753 1,185 1,720 1,650 1,576
Total commercial loans and leases 50,480 44,870 41,300 36,615 33,544
Sales finance 6,354 6,021 5,683 5,264 5,176
Revolving credit 1,777 1,618 1,414 1,347 1,277
Direct retail 15,454 15,691 15,312 14,453 13,585
Residential mortgage loans 17,091 17,467 15,596 13,971 11,715
Specialized lending 6,089 5,240 3,606 2,744 2,253
Total loans held for investment 97,245 90,907 82,911 74,394 67,550
Total loans held for sale 1,424 779 680 629 613
Total loans and leases $98,669 $91,686 $83,591 $75,023 $68,163
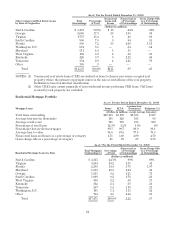
The following table reflects the scheduled maturities of commercial, financial and agricultural loans, as well
as real estate construction loans:
Table 4
Selected Loan Maturities and Interest Sensitivity (1)
December 31, 2008
Commercial,
Financial
and
Agricultural Real Estate:
Construction Total
(Dollars in millions)
Fixed rate:
1 year or less (2) $ 1,858 $ 931 $ 2,789
1-5 years 1,892 1,878 3,770
After 5 years 2,535 3,079 5,614
Total 6,285 5,888 12,173
Variable rate:
1 year or less (2) 6,665 8,452 15,117
1-5 years 3,301 4,462 7,763
After 5 years 880 1,263 2,143
Total 10,846 14,177 25,023
Total loans and leases (3) $17,131 $20,065 $37,196
(1) Balances include unearned income.
(2) Includes loans due on demand.
20