BB&T 2008 Annual Report Download - page 22
Download and view the complete annual report
Please find page 22 of the 2008 BB&T annual report below. You can navigate through the pages in the report by either clicking on the pages listed below, or by using the keyword search tool below to find specific information within the annual report.-
 1
1 -
2
-
3
-
4
-
5
-
6
-
7
-
8
-
9
-
10
-
11
-
 12
12 -
 13
13 -
 14
14 -
 15
15 -
 16
16 -
 17
17 -
 18
18 -
 19
19 -
 20
20 -
 21
21 -
 22
22 -
 23
23 -
 24
24 -
 25
25 -
 26
26 -
 27
27 -
 28
28 -
 29
29 -
 30
30 -
 31
31 -
 32
32 -
33
-
34
-
35
-
36
-
37
-
38
-
39
-
40
-
41
-
42
-
43
-
44
-
45
-
46
-
47
-
48
-
49
-
50
-
51
-
52
-
53
-
54
-
55
-
56
-
57
-
58
-
59
-
60
-
61
-
62
-
63
-
64
-
65
-
66
-
67
-
68
-
69
-
70
-
71
-
72
-
73
-
74
-
75
-
76
-
77
-
78
-
79
-
80
-
81
-
82
-
83
-
84
-
85
-
86
-
87
-
88
-
89
-
90
-
91
-
92
-
93
-
94
-
95
-
96
-
97
-
98
-
99
-
100
-
101
-
102
-
103
-
104
-
105
-
106
-
107
-
108
-
109
-
110
-
111
-
112
-
113
-
114
-
115
-
116
-
117
-
118
-
119
-
120
-
121
-
122
-
123
-
124
-
125
-
126
-
127
-
128
-
129
-
130
-
131
-
132
-
133
-
134
-
135
-
136
-
137
-
138
-
139
-
140
-
141
-
142
-
143
-
144
-
145
-
146
-
147
-
148
-
149
-
150
-
151
-
152
 |
 |

assigned a “risk grade” at origination by the account officer and the assigned risk grade is subsequently reviewed
and finalized through BB&T’s established loan review committee process. Loans are assigned risk grades based
on an assessment of conditions that affect the borrower’s ability to meet contractual obligations under the loan
agreement. This process includes reviewing borrowers’ financial information, historical payment experience,
credit documentation, public information, and other information specific to each borrower. The established risk
management regimen includes a review of all credit relationships with total credit exposure of $1 million or more
on an annual basis or at any point management becomes aware of information affecting the borrower’s ability to
fulfill their obligations. For small business and commercial clients where total credit exposure is less than $1
million, BB&T has developed an automated loan review system to identify and proactively manage accounts with
a higher risk of loss. The “score” produced by this automated system is updated monthly. All of the loan portfolios
grouped in the retail lending and specialized lending categories typically employ scoring models to segment
credits into groups with homogenous risk characteristics. Scoring models are validated on a periodic basis in
order to ensure reliable default rate information. This information is employed to evaluate the levels of risk
associated with new production as well as to assess any risk migration in the existing portfolio.
A small portion of the Corporation’s allowance for loan and lease losses is not allocated to any specific category
of loans. This unallocated portion of the allowance reflects management’s best estimate of the elements of
imprecision and estimation risk inherent in the calculation of the overall allowance. Due to the subjectivity involved
in determining the overall allowance, including the unallocated portion, the portion considered unallocated may
fluctuate from period to period based on management’s evaluation of the factors affecting the assumptions used in
calculating the allowance, including historical loss experience, current economic conditions, industry or borrower
concentrations and the status of merged institutions. The allocated and unallocated portions of the allowance are
available to absorb losses in any loan or lease category. Management evaluates the adequacy of the allowance for
loan and lease losses based on the combined total of the allocated and unallocated components.
While management uses the best information available to establish the allowance for loan and lease losses,
future adjustments to the allowance or to the reserving methodology may be necessary if economic conditions
differ substantially from the assumptions used in making the valuations.
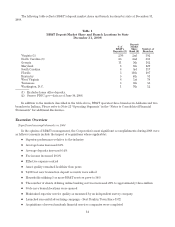
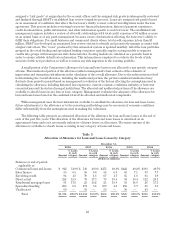
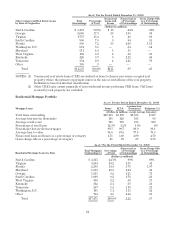
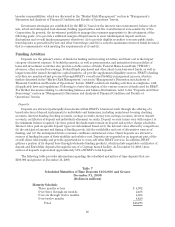
The following table presents an estimated allocation of the allowance for loan and lease losses at the end of
each of the past five years. This allocation of the allowance for loan and lease losses is calculated on an
approximate basis and is not necessarily indicative of future losses or allocations. The entire amount of the
allowance is available to absorb losses occurring in any category of loans and leases.
Table 5
Allocation of Allowance for Loan and Lease Losses by Category
December 31,
2008 2007 2006 2005 2004
Amount
% Loans
in each
category Amount
% Loans
in each
category Amount
% Loans
in each
category Amount
% Loans
in each
category Amount
% Loans
in each
category
(Dollars in millions)
Balances at end of period
applicable to:
Commercial loans and leases $ 912 51.9% $ 548 49.3% $475 49.8% $422 49.2% $393 49.7%
Sales finance 55 6.5 58 6.6 58 6.9 65 7.1 87 7.7
Revolving credit 94 1.8 70 1.8 67 1.7 65 1.8 63 1.9
Direct retail 124 15.9 79 17.3 75 18.5 94 19.4 112 20.1
Residential mortgage loans 91 17.6 25 19.2 21 18.8 19 18.8 26 17.3
Specialized lending 238 6.3 171 5.8 139 4.3 110 3.7 81 3.3
Unallocated 60 — 53 — 53 — 50 — 43 —
Total $1,574 100.0% $1,004 100.0% $888 100.0% $825 100.0% $805 100.0%
22