BB&T 2008 Annual Report Download - page 119
Download and view the complete annual report
Please find page 119 of the 2008 BB&T annual report below. You can navigate through the pages in the report by either clicking on the pages listed below, or by using the keyword search tool below to find specific information within the annual report.-
 1
1 -
2
-
3
-
4
-
5
-
6
-
7
-
8
-
9
-
10
-
11
-
12
-
13
-
14
-
15
-
16
-
17
-
18
-
19
-
20
-
21
-
22
-
23
-
24
-
25
-
26
-
27
-
28
-
29
-
30
-
31
-
32
-
33
-
34
-
35
-
36
-
37
-
38
-
39
-
40
-
41
-
42
-
43
-
44
-
45
-
46
-
47
-
48
-
49
-
50
-
51
-
52
-
53
-
54
-
55
-
56
-
57
-
58
-
59
-
60
-
61
-
62
-
63
-
64
-
65
-
66
-
67
-
68
-
69
-
70
-
71
-
72
-
73
-
74
-
75
-
76
-
77
-
78
-
79
-
80
-
81
-
82
-
83
-
84
-
85
-
86
-
87
-
88
-
89
-
90
-
91
-
92
-
93
-
94
-
95
-
96
-
97
-
98
-
99
-
100
-
101
-
102
-
103
-
104
-
105
-
106
-
107
-
108
-
 109
109 -
 110
110 -
 111
111 -
 112
112 -
 113
113 -
 114
114 -
 115
115 -
 116
116 -
 117
117 -
 118
118 -
 119
119 -
 120
120 -
 121
121 -
 122
122 -
 123
123 -
 124
124 -
 125
125 -
 126
126 -
 127
127 -
 128
128 -
 129
129 -
130
-
131
-
132
-
133
-
134
-
135
-
136
-
137
-
138
-
139
-
140
-
141
-
142
-
143
-
144
-
145
-
146
-
147
-
148
-
149
-
150
-
151
-
152
 |
 |

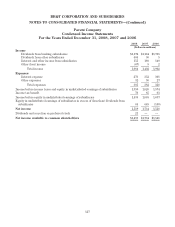
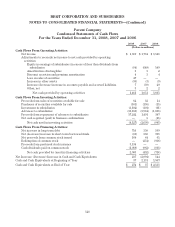
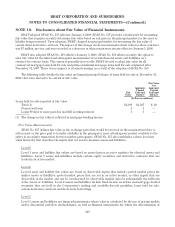
BB&T CORPORATION AND SUBSIDIARIES
NOTES TO CONSOLIDATED FINANCIAL STATEMENTS—(Continued)
The weighted average expected long-term rate of return on plan assets represents the average rate of return
expected to be earned on plan assets over the period the benefits included in the benefit obligation are to be paid.
In developing the expected rate of return, BB&T considers long-term compound annualized returns of historical
market data for each asset category, as well as historical actual returns on the Company’s plan assets. Using this
reference information, the Company develops forward-looking return expectations for each asset category and a
weighted average expected long-term rate of return for the plan based on target asset allocations contained in
BB&T’s Investment Policy Statement.
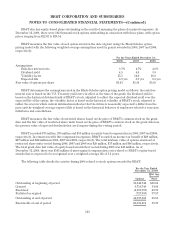
Financial data relative to the defined benefit pension plans is summarized in the following tables for the
years indicated. The qualified pension plan prepaid asset is recorded on the Consolidated Balance Sheets as a
component of other assets and the nonqualified pension plans accrued liability is recorded on the Consolidated
Balance Sheets as a component of other liabilities. The data is calculated using an actuarial measurement date of
December 31.
For the Years Ended
December 31,
2008 2007 2006
(Dollars in millions)
Net Periodic Pension Cost
Service cost $ 69 $ 74 $ 65
Interest cost 81 74 65
Estimated return on plan assets (139) (120) (92)
Net amortization and other (2) 4 12
Net periodic pension cost 9 32 50
Pre-Tax Amounts Recognized in Comprehensive Income
Net actuarial (gain) loss 590 (54) —
Amortization of prior service cost 4 4 —
Amortization of net (gain) loss (2) (8) —
Net (income) cost for minimum pension liability — — (4)
Net amount recognized in comprehensive income 592 (58) (4)
Total net periodic pension (income) costs recognized in
comprehensive income $ 601 $ (26) $ 46
The following are the significant actuarial assumptions that were used to determine benefit obligations:
December 31,
2008 2007
Actuarial Assumptions
Weighted average assumed discount rate 6.20% 6.60%
Assumed rate of annual compensation increases 4.50 4.50
119