BB&T 2008 Annual Report Download - page 76
Download and view the complete annual report
Please find page 76 of the 2008 BB&T annual report below. You can navigate through the pages in the report by either clicking on the pages listed below, or by using the keyword search tool below to find specific information within the annual report.-
 1
1 -
2
-
3
-
4
-
5
-
6
-
7
-
8
-
9
-
10
-
11
-
12
-
13
-
14
-
15
-
16
-
17
-
18
-
19
-
20
-
21
-
22
-
23
-
24
-
25
-
26
-
27
-
28
-
29
-
30
-
31
-
32
-
33
-
34
-
35
-
36
-
37
-
38
-
39
-
40
-
41
-
42
-
43
-
44
-
45
-
46
-
47
-
48
-
49
-
50
-
51
-
52
-
53
-
54
-
55
-
56
-
57
-
58
-
59
-
60
-
61
-
62
-
63
-
64
-
65
-
 66
66 -
 67
67 -
 68
68 -
 69
69 -
 70
70 -
 71
71 -
 72
72 -
 73
73 -
 74
74 -
 75
75 -
 76
76 -
 77
77 -
 78
78 -
 79
79 -
 80
80 -
 81
81 -
 82
82 -
 83
83 -
 84
84 -
 85
85 -
 86
86 -
87
-
88
-
89
-
90
-
91
-
92
-
93
-
94
-
95
-
96
-
97
-
98
-
99
-
100
-
101
-
102
-
103
-
104
-
105
-
106
-
107
-
108
-
109
-
110
-
111
-
112
-
113
-
114
-
115
-
116
-
117
-
118
-
119
-
120
-
121
-
122
-
123
-
124
-
125
-
126
-
127
-
128
-
129
-
130
-
131
-
132
-
133
-
134
-
135
-
136
-
137
-
138
-
139
-
140
-
141
-
142
-
143
-
144
-
145
-
146
-
147
-
148
-
149
-
150
-
151
-
152
 |
 |
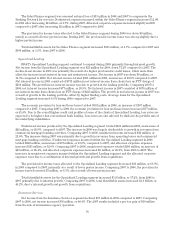
The Sales Finance segment was assessed referral fees of $13 million in 2008 and 2007 to compensate the
Banking Network for services. Noninterest expenses incurred within the Sales Finance segment increased 12.0%
in 2008 after increasing $2 million, or 8.7%, during 2007. Allocated corporate expense increased slightly in 2008
compared to 2007 after increasing $2 million in 2007 compared to 2006.
The provision for income taxes allocated to the Sales Finance segment during 2008 was down $9 million,
mainly as a result of lower pretax income. During 2007, the provision for income taxes was also up slightly due to
higher pretax income.
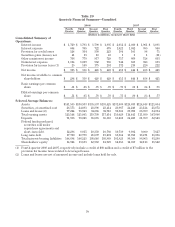
Total identifiable assets for the Sales Finance segment increased $331 million, or 5.7%, compared to 2007 and
$300 million, or 5.5%, from 2007 to 2006.
Specialized Lending
BB&T’s Specialized Lending segment continued to expand during 2008 primarily through internal growth.
Net income from the Specialized Lending segment was $21 million for 2008, down 71.2% compared to 2007. The
decline in net income in 2008 was primarily the result of a higher provision for credit losses, which more than
offset the increase in net interest income and noninterest income. Net income in 2007 was down $9 million, or
11.0% compared to 2006. Net interest income totaled $501 million in 2008, an increase of 10.6% compared to 2007.
Net interest income in 2008 consisted of $711 million in net interest income from clients less an FTP charge of
$210 million. The growth in net interest income was due to growth in the lending portfolio. Comparing 2007 to
2006, net interest income increased $77 million, or 20.5%. Net interest income in 2007 consisted of $676 million of
net interest income from clients less an FTP charge of $223 million. The growth in net interest income in 2007 was
a result of growth in the lending portfolio, offset by higher funding costs. Average loans for the Specialized
Lending segment increased 8.6% during 2008 compared to 2007.
The economic provision for loan and lease losses totaled $301 million in 2008, an increase of $107 million
compared to 2007. Comparing 2007 to 2006 the economic provision for loan and lease losses increased $57 million,
or 41.6%. Due to the overall higher credit risk profiles of some of the clients of Specialized Lending, loss rates are
expected to be higher than conventional bank lending. Loss rates are also affected by shifts in the portfolio mix of
the underlying subsidiaries.
Noninterest income produced by the Specialized Lending segment totaled $116 million in 2008, an increase of
$26 million, or 28.9%, compared to 2007. The increase in 2008 was largely attributable to growth in revenues from
commercial mortgage banking activities. Comparing 2007 to 2006, noninterest income increased $16 million, or
21.6%. The increase during 2007 was primarily due to growth in revenues from operating leases and commercial
mortgage banking activities. Noninterest expenses incurred within the Specialized Lending segment in 2008
totaled $243 million, an increase of $37 million, or 18.0%, compared to 2007, and allocated corporate expenses
increased $13 million, or 52.0%. Comparing 2007 to 2006, noninterest expenses totaled $206 million, an increase of
$43 million, or 26.4%, and allocated corporate expenses increased $5 million, or 25.0%, from 2006 to 2007. The
increases in noninterest expenses incurred within the Specialized Lending segment and the allocated corporate
expenses were due to a combination of internal growth and growth from acquisitions.
The provision for income taxes allocated to the Specialized Lending segment decreased $31 million, or 68.9%,
in 2008 compared to 2007, primarily as a result of lower pretax income. Comparing 2007 to 2006, the provision for
income taxes decreased $3 million, or 6.3%, also a result of lower pretax income.
Total identifiable assets for the Specialized Lending segment increased $1.0 billion, or 17.2%, from 2008 to
2007 primarily due to internal growth. Comparing 2007 to 2006, total identifiable assets increased $1.8 billion, or
48.2%, due to internal growth and growth from acquisitions.
Insurance Services
Net income from the Insurance Services segment declined $17 million in 2008 compared to 2007. Comparing
2007 to 2006, net income increased $36 million, or 40.4%. The 2007 results included a pre-tax gain of $19 million
from the sale of an insurance agency operation.
76