BB&T 2008 Annual Report Download - page 105
Download and view the complete annual report
Please find page 105 of the 2008 BB&T annual report below. You can navigate through the pages in the report by either clicking on the pages listed below, or by using the keyword search tool below to find specific information within the annual report.-
 1
1 -
2
-
3
-
4
-
5
-
6
-
7
-
8
-
9
-
10
-
11
-
12
-
13
-
14
-
15
-
16
-
17
-
18
-
19
-
20
-
21
-
22
-
23
-
24
-
25
-
26
-
27
-
28
-
29
-
30
-
31
-
32
-
33
-
34
-
35
-
36
-
37
-
38
-
39
-
40
-
41
-
42
-
43
-
44
-
45
-
46
-
47
-
48
-
49
-
50
-
51
-
52
-
53
-
54
-
55
-
56
-
57
-
58
-
59
-
60
-
61
-
62
-
63
-
64
-
65
-
66
-
67
-
68
-
69
-
70
-
71
-
72
-
73
-
74
-
75
-
76
-
77
-
78
-
79
-
80
-
81
-
82
-
83
-
84
-
85
-
86
-
87
-
88
-
89
-
90
-
91
-
92
-
93
-
94
-
 95
95 -
 96
96 -
 97
97 -
 98
98 -
 99
99 -
 100
100 -
 101
101 -
 102
102 -
 103
103 -
 104
104 -
 105
105 -
 106
106 -
 107
107 -
 108
108 -
 109
109 -
 110
110 -
 111
111 -
 112
112 -
 113
113 -
 114
114 -
 115
115 -
116
-
117
-
118
-
119
-
120
-
121
-
122
-
123
-
124
-
125
-
126
-
127
-
128
-
129
-
130
-
131
-
132
-
133
-
134
-
135
-
136
-
137
-
138
-
139
-
140
-
141
-
142
-
143
-
144
-
145
-
146
-
147
-
148
-
149
-
150
-
151
-
152
 |
 |

BB&T CORPORATION AND SUBSIDIARIES
NOTES TO CONSOLIDATED FINANCIAL STATEMENTS—(Continued)
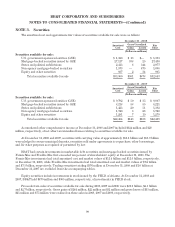
The unpaid principal balances of BB&T’s total residential mortgage servicing portfolio were $59.7 billion,
$51.0 billion and $45.2 billion at December 31, 2008, 2007 and 2006, respectively. The unpaid principal balances of
residential mortgage loans serviced for others consist primarily of agency conforming fixed-rate mortgage loans
and totaled $40.7 billion, $32.1 billion and $28.2 billion at December 31, 2008, 2007 and 2006, respectively.
Mortgage loans serviced for others are not included in loans on the accompanying Consolidated Balance Sheets.
BB&T recognized servicing fees of $145 million, $114 million and $102 million during 2008, 2007 and 2006,
respectively, as a component of mortgage banking income.
During 2008, 2007 and 2006, BB&T sold residential mortgage loans with unpaid principal balances of $13.4
billion, $7.5 billion and $5.3 billion, respectively, and recognized pretax gains of $78 million, $12 million and $19
million, respectively, which were recorded in noninterest income as a component of mortgage banking income.
BB&T retained the related mortgage servicing rights and receives servicing fees. At December 31, 2008 and
2007, the approximate weighted average servicing fee was .37% and .36%, respectively, of the outstanding
balance of the residential mortgage loans. The weighted average coupon interest rate on the portfolio of mortgage
loans serviced for others was 6.03% and 6.01% at December 31, 2008 and 2007, respectively.
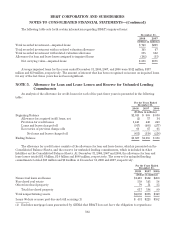
At December 31, 2008, BB&T had $822 million of residential mortgage loans sold with limited recourse
liability. In the event of nonperformance by the borrower, BB&T has maximum recourse exposure of
approximately $741 million on these mortgage loans.
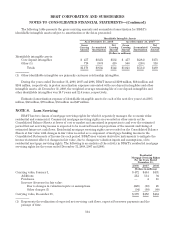
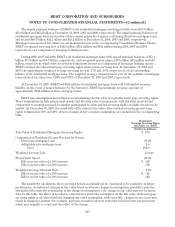
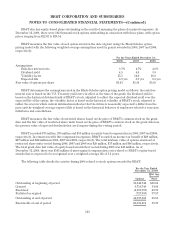
BB&T uses assumptions and estimates in determining the fair value of capitalized mortgage servicing rights.
These assumptions include prepayment speeds and discount rates commensurate with the risks involved and
comparable to assumptions used by market participants to value and bid servicing rights available for sale in the
market. At December 31, 2008, the sensitivity of the current fair value of the residential mortgage servicing
rights to immediate 10% and 20% adverse changes in key economic assumptions are included in the accompanying
table.
Residential
Mortgage Servicing Rights
December 31, 2008
(Dollars in millions)
Fair Value of Residential Mortgage Servicing Rights $ 370
Composition of Residential Loans Serviced for Others:
Fixed-rate mortgage loans 98.0%
Adjustable-rate mortgage loans 2.0
Total 100.0
Weighted Average Life 2.6 yrs
Prepayment Speed 29.0%
Effect on fair value of a 10% increase $ (27)
Effect on fair value of a 20% increase (50)
Weighted Average Discount Rate 9.6%
Effect on fair value of a 10% increase $ (14)
Effect on fair value of a 20% increase (26)
The sensitivity calculations above are hypothetical and should not be considered to be predictive of future
performance. As indicated, changes in fair value based on adverse changes in assumptions generally cannot be
extrapolated because the relationship of the change in assumption to the change in fair value may not be linear.
Also, in this table, the effect of an adverse variation in a particular assumption on the fair value of the mortgage
servicing rights is calculated without changing any other assumption; while in reality, changes in one factor may
result in changes in another (for example, increases in market interest rates may result in lower prepayments),
which may magnify or counteract the effect of the change.
105