BB&T 2008 Annual Report Download - page 48
Download and view the complete annual report
Please find page 48 of the 2008 BB&T annual report below. You can navigate through the pages in the report by either clicking on the pages listed below, or by using the keyword search tool below to find specific information within the annual report.-
 1
1 -
2
-
3
-
4
-
5
-
6
-
7
-
8
-
9
-
10
-
11
-
12
-
13
-
14
-
15
-
16
-
17
-
18
-
19
-
20
-
21
-
22
-
23
-
24
-
25
-
26
-
27
-
28
-
29
-
30
-
31
-
32
-
33
-
34
-
35
-
36
-
37
-
 38
38 -
 39
39 -
 40
40 -
 41
41 -
 42
42 -
 43
43 -
 44
44 -
 45
45 -
 46
46 -
 47
47 -
 48
48 -
 49
49 -
 50
50 -
 51
51 -
 52
52 -
 53
53 -
 54
54 -
 55
55 -
 56
56 -
 57
57 -
 58
58 -
59
-
60
-
61
-
62
-
63
-
64
-
65
-
66
-
67
-
68
-
69
-
70
-
71
-
72
-
73
-
74
-
75
-
76
-
77
-
78
-
79
-
80
-
81
-
82
-
83
-
84
-
85
-
86
-
87
-
88
-
89
-
90
-
91
-
92
-
93
-
94
-
95
-
96
-
97
-
98
-
99
-
100
-
101
-
102
-
103
-
104
-
105
-
106
-
107
-
108
-
109
-
110
-
111
-
112
-
113
-
114
-
115
-
116
-
117
-
118
-
119
-
120
-
121
-
122
-
123
-
124
-
125
-
126
-
127
-
128
-
129
-
130
-
131
-
132
-
133
-
134
-
135
-
136
-
137
-
138
-
139
-
140
-
141
-
142
-
143
-
144
-
145
-
146
-
147
-
148
-
149
-
150
-
151
-
152
 |
 |

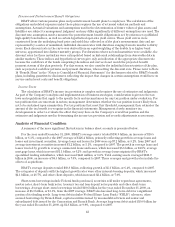
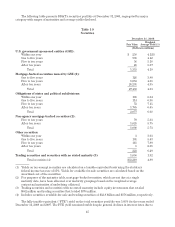
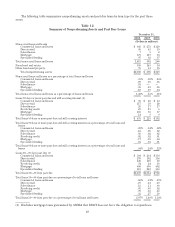
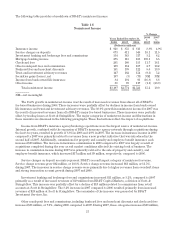
The following table summarizes asset quality information for the past five years.
Table 11
Asset Quality
December 31,
2008 2007 2006 2005 2004
(Dollars in millions)
Nonaccrual loans and leases $1,413 $ 502 $ 260 $ 229 $ 269
Foreclosed property 617 194 89 71 89
Nonperforming assets $2,030 $ 696 $ 349 $ 300 $ 358
Loans 90 days or more past due and still accruing (2) $ 431 $ 223 $ 102 $ 103 $ 100
Loans 30—89 days past due (2) $2,047 $1,354 $ 952 $ 695 $ 619
Asset Quality Ratios: (1)
Nonaccrual loans and leases as a percentage of loans and leases 1.43% .55% .31% .31% .39%
Nonperforming assets as a percentage of:
Total assets 1.34 .52 .29 .27 .36
Loans and leases plus foreclosed property 2.04 .76 .42 .40 .52
Loans 90 days or more past due and still accruing as a percentage of
loans and leases (2) .44 .24 .12 .14 .15
Loans 30-89 days past due as a percentage of loans and leases (2) 2.07 1.48 1.14 .93 .91
Net charge-offs as a percentage of average loans and leases .89 .38 .27 .30 .36
Allowance for loan and lease losses as a percentage of loans and leases 1.60 1.10 1.06 1.10 1.18
Allowance for loan and lease losses as a percentage of loans and leases
held for investment 1.62 1.10 1.07 1.11 1.19
Ratio of allowance for loan and leases to:
Net charge-offs 1.85x 2.97x 4.12x 3.84x 3.42x
Nonaccrual loans and leases 1.11 2.00 3.41 3.60 2.99
NOTE: (1) Items referring to loans and leases are net of unearned income and, except for loans and leases held
for investment, include loans held for sale.
(2) Excludes mortgage loans guaranteed by GNMA that BB&T does not have the obligation to
repurchase.
During 2008, BB&T’s credit quality declined as a result of a very challenging economic environment.
Nonperforming assets and credit losses increased further during the year as a result of the distressed residential
real estate market and economic recession. Nonperforming assets increased from .52% of total assets at
December 31, 2007 to 1.34% at year-end 2008. Net charge-offs for 2008 were .89% of average loans and leases and
reflected an increase of 51 basis points from the .38% level recorded during 2007. The increases in nonperforming
assets and net charge-offs were driven by continued deterioration in residential real estate markets and the
overall economy with the largest concentration of credit issues occurring in Georgia, Florida and metro
Washington, D.C. If the economy continues to deteriorate as is currently forecasted, management anticipates
that net charge-offs and nonperforming assets will continue to increase into 2009.
48