BB&T 2008 Annual Report Download - page 125
Download and view the complete annual report
Please find page 125 of the 2008 BB&T annual report below. You can navigate through the pages in the report by either clicking on the pages listed below, or by using the keyword search tool below to find specific information within the annual report.-
 1
1 -
2
-
3
-
4
-
5
-
6
-
7
-
8
-
9
-
10
-
11
-
12
-
13
-
14
-
15
-
16
-
17
-
18
-
19
-
20
-
21
-
22
-
23
-
24
-
25
-
26
-
27
-
28
-
29
-
30
-
31
-
32
-
33
-
34
-
35
-
36
-
37
-
38
-
39
-
40
-
41
-
42
-
43
-
44
-
45
-
46
-
47
-
48
-
49
-
50
-
51
-
52
-
53
-
54
-
55
-
56
-
57
-
58
-
59
-
60
-
61
-
62
-
63
-
64
-
65
-
66
-
67
-
68
-
69
-
70
-
71
-
72
-
73
-
74
-
75
-
76
-
77
-
78
-
79
-
80
-
81
-
82
-
83
-
84
-
85
-
86
-
87
-
88
-
89
-
90
-
91
-
92
-
93
-
94
-
95
-
96
-
97
-
98
-
99
-
100
-
101
-
102
-
103
-
104
-
105
-
106
-
107
-
108
-
109
-
110
-
111
-
112
-
113
-
114
-
 115
115 -
 116
116 -
 117
117 -
 118
118 -
 119
119 -
 120
120 -
 121
121 -
 122
122 -
 123
123 -
 124
124 -
 125
125 -
 126
126 -
 127
127 -
 128
128 -
 129
129 -
 130
130 -
 131
131 -
 132
132 -
 133
133 -
 134
134 -
 135
135 -
136
-
137
-
138
-
139
-
140
-
141
-
142
-
143
-
144
-
145
-
146
-
147
-
148
-
149
-
150
-
151
-
152
 |
 |

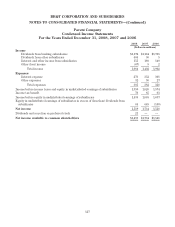
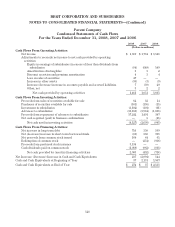
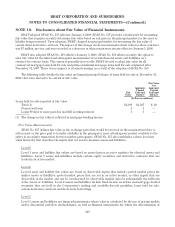
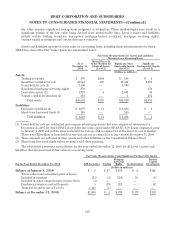
BB&T CORPORATION AND SUBSIDIARIES
NOTES TO CONSOLIDATED FINANCIAL STATEMENTS—(Continued)
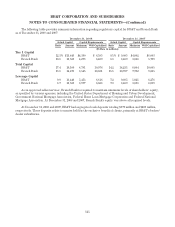
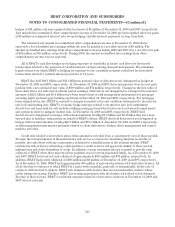
The following table provides summary information regarding regulatory capital for BB&T and Branch Bank
as of December 31, 2008 and 2007:
December 31, 2008 December 31, 2007
Actual Capital Capital Requirements Actual Capital Capital Requirements
Ratio Amount Minimum Well-Capitalized Ratio Amount Minimum Well-Capitalized
(Dollars in millions)
Tier 1 Capital
BB&T 12.3% $13,446 $4,390 $ 6,585 9.1% $ 9,085 $4,002 $6,003
Branch Bank 10.8 11,533 4,273 6,409 8.8 8,469 3,866 5,799
Total Capital
BB&T 17.4 19,109 8,781 10,976 14.2 14,233 8,004 10,005
Branch Bank 13.6 14,475 8,545 10,681 11.1 10,707 7,732 9,665
Leverage Capital
BB&T 9.9 13,446 5,453 6,816 7.2 9,085 5,021 6,276
Branch Bank 8.7 11,533 3,977 6,628 7.0 8,469 3,636 6,059
As an approved seller/servicer, Branch Bank is required to maintain minimum levels of shareholders’ equity,
as specified by various agencies, including the United States Department of Housing and Urban Development,
Government National Mortgage Association, Federal Home Loan Mortgage Corporation and Federal National
Mortgage Association. At December 31, 2008 and 2007, Branch Bank’s equity was above all required levels.
At December 31, 2008 and 2007, BB&T had segregated cash deposits totaling $379 million and $208 million,
respectively. These deposits relate to monies held for the exclusive benefit of clients, primarily at BB&T’s broker/
dealer subsidiaries.
125