BB&T 2008 Annual Report Download - page 87
Download and view the complete annual report
Please find page 87 of the 2008 BB&T annual report below. You can navigate through the pages in the report by either clicking on the pages listed below, or by using the keyword search tool below to find specific information within the annual report.-
 1
1 -
2
-
3
-
4
-
5
-
6
-
7
-
8
-
9
-
10
-
11
-
12
-
13
-
14
-
15
-
16
-
17
-
18
-
19
-
20
-
21
-
22
-
23
-
24
-
25
-
26
-
27
-
28
-
29
-
30
-
31
-
32
-
33
-
34
-
35
-
36
-
37
-
38
-
39
-
40
-
41
-
42
-
43
-
44
-
45
-
46
-
47
-
48
-
49
-
50
-
51
-
52
-
53
-
54
-
55
-
56
-
57
-
58
-
59
-
60
-
61
-
62
-
63
-
64
-
65
-
66
-
67
-
68
-
69
-
70
-
71
-
72
-
73
-
74
-
75
-
76
-
 77
77 -
 78
78 -
 79
79 -
 80
80 -
 81
81 -
 82
82 -
 83
83 -
 84
84 -
 85
85 -
 86
86 -
 87
87 -
 88
88 -
 89
89 -
 90
90 -
 91
91 -
 92
92 -
 93
93 -
 94
94 -
 95
95 -
 96
96 -
 97
97 -
98
-
99
-
100
-
101
-
102
-
103
-
104
-
105
-
106
-
107
-
108
-
109
-
110
-
111
-
112
-
113
-
114
-
115
-
116
-
117
-
118
-
119
-
120
-
121
-
122
-
123
-
124
-
125
-
126
-
127
-
128
-
129
-
130
-
131
-
132
-
133
-
134
-
135
-
136
-
137
-
138
-
139
-
140
-
141
-
142
-
143
-
144
-
145
-
146
-
147
-
148
-
149
-
150
-
151
-
152
 |
 |

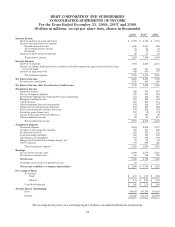
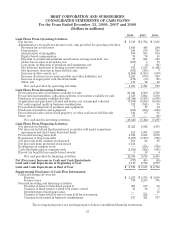
BB&T CORPORATION AND SUBSIDIARIES
CONSOLIDATED STATEMENTS OF CASH FLOWS
For the Years Ended December 31, 2008, 2007 and 2006
(Dollars in millions)
2008 2007 2006
Cash Flows From Operating Activities:
Net income $1,519 $1,734 $1,528
Adjustments to reconcile net income to net cash provided by operating activities:
Provision for credit losses 1,445 448 240
Depreciation 198 179 188
Amortization of intangibles 100 104 104
Equity-based compensation 75 70 58
Discount accretion and premium amortization on long-term debt, net 94 121 126
(Gain) loss on sales of securities, net (107) 3 73
Loss (gain) on disposals of premises and equipment, net 4 (2) (31)
Net decrease (increase) in trading account securities 633 1,138 (1,434)
Net (increase) decrease in loans held for sale (591) (383) 7
Increase in other assets, net (2,264) (1,505) (539)
Increase (decrease) in accounts payable and other liabilities, net 4,245 (873) 503
Increase in segregated cash due from banks (171) (55) (68)
Other, net 175 72 12
Net cash provided by operating activities 5,355 1,051 767
Cash Flows From Investing Activities:
Proceeds from sales of securities available for sale 21,044 2,500 2,730
Proceeds from maturities, calls and paydowns of securities available for sale 4,539 5,604 1,670
Purchases of securities available for sale (36,348) (8,987) (5,076)
Originations and purchases of loans and leases, net of principal collected (7,894) (6,286) (6,550)
Net cash acquired (paid) in business combinations 311 (141) 38
Proceeds from disposals of premises and equipment 6 17 84
Purchases of premises and equipment (219) (256) (250)
Proceeds from sales of foreclosed property or other real estate held for sale 143 87 85
Other, net 95 — (18)
Net cash used in investing activities (18,323) (7,462) (7,287)
Cash Flows From Financing Activities:
Net increase in deposits 11,325 4,824 4,475
Net increase in federal funds purchased, securities sold under repurchase
agreements and short-term borrowed funds 151 1,004 1,286
Proceeds from long-term debt 5,702 5,831 3,176
Repayment of long-term debt (6,867) (3,709) (798)
Net proceeds from common stock issued 160 64 91
Net proceeds from preferred stock issued 3,134 — —
Redemption of common stock — (254) (936)
Cash dividends paid on common stock (1,019) (962) (863)
Excess tax benefit from equity-based awards 5 18 4
Net cash provided by financing activities 12,591 6,816 6,435
Net (Decrease) Increase in Cash and Cash Equivalents (377) 405 (85)
Cash and Cash Equivalents at Beginning of Year 3,117 2,712 2,797
Cash and Cash Equivalents at End of Year $ 2,740 $3,117 $2,712
Supplemental Disclosure of Cash Flow Information:
Cash paid during the year for:
Interest $2,937 $3,978 $3,069
Income taxes 730 2,233 791
Noncash investing and financing activities:
Transfer of loans to foreclosed property 600 179 85
Transfer of fixed assets to other real estate owned 13 16 8
Securitization of mortgage loans — — 51
Transfer of loans held for sale to loans held for investment — 264 —
Common stock issued in business combinations 197 411 757
The accompanying notes are an integral part of these consolidated financial statements.
87