BB&T 2008 Annual Report Download - page 74
Download and view the complete annual report
Please find page 74 of the 2008 BB&T annual report below. You can navigate through the pages in the report by either clicking on the pages listed below, or by using the keyword search tool below to find specific information within the annual report.-
 1
1 -
2
-
3
-
4
-
5
-
6
-
7
-
8
-
9
-
10
-
11
-
12
-
13
-
14
-
15
-
16
-
17
-
18
-
19
-
20
-
21
-
22
-
23
-
24
-
25
-
26
-
27
-
28
-
29
-
30
-
31
-
32
-
33
-
34
-
35
-
36
-
37
-
38
-
39
-
40
-
41
-
42
-
43
-
44
-
45
-
46
-
47
-
48
-
49
-
50
-
51
-
52
-
53
-
54
-
55
-
56
-
57
-
58
-
59
-
60
-
61
-
62
-
63
-
 64
64 -
 65
65 -
 66
66 -
 67
67 -
 68
68 -
 69
69 -
 70
70 -
 71
71 -
 72
72 -
 73
73 -
 74
74 -
 75
75 -
 76
76 -
 77
77 -
 78
78 -
 79
79 -
 80
80 -
 81
81 -
 82
82 -
 83
83 -
 84
84 -
85
-
86
-
87
-
88
-
89
-
90
-
91
-
92
-
93
-
94
-
95
-
96
-
97
-
98
-
99
-
100
-
101
-
102
-
103
-
104
-
105
-
106
-
107
-
108
-
109
-
110
-
111
-
112
-
113
-
114
-
115
-
116
-
117
-
118
-
119
-
120
-
121
-
122
-
123
-
124
-
125
-
126
-
127
-
128
-
129
-
130
-
131
-
132
-
133
-
134
-
135
-
136
-
137
-
138
-
139
-
140
-
141
-
142
-
143
-
144
-
145
-
146
-
147
-
148
-
149
-
150
-
151
-
152
 |
 |
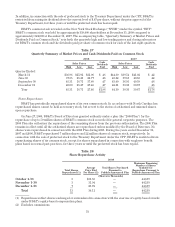
Segment Results
BB&T’s operations are divided into seven reportable business segments: the Banking Network, Residential
Mortgage Banking, Sales Finance, Specialized Lending, Insurance Services, Financial Services, and Treasury.
These operating segments have been identified based primarily on BB&T’s organizational structure. See Note 21
“Operating Segments”, in the “Notes to Consolidated Financial Statements” herein, for additional disclosures
related to BB&T’s operating segments, the internal accounting and reporting practices used to manage these
segments and financial disclosures for these segments as required by SFAS No. 131, “Disclosures about
Segments of an Enterprise and Related Information.” Fluctuations in noninterest income and noninterest
expense incurred directly by the segments are more fully discussed in the “Noninterest Income” and
“Noninterest Expense” sections of this discussion and analysis. Merger-related expenses in 2008, 2007 and 2006,
the gains related to BB&T’s ownership interest with Visa, Inc. in 2008, certain securities gains and losses
recorded in 2008, the net impact of the after-tax gain associated with BB&T’s leveraged lease settlement
recorded in 2008, the additional tax provision recorded in 2006, the loss on sales of securities incurred in
connection with the partial portfolio restructuring in 2006 and certain other charges are excluded from segment
results as presented herein.
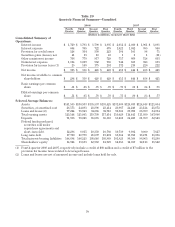
Banking Network
The Banking Network had solid internal loan and deposit growth during 2008, with total assets at year-end
2008 increasing 7.6% compared to 2007. The total Banking Network was composed of 1,511 banking offices at the
end of 2008, an increase of 19 offices compared to 1,492 banking offices at December 31, 2007. The increase in
offices was the result of a de novo branching strategy to expand BB&T’s presence in high growth markets and
the acquisition of Haven Trust. Net income attributable to the Banking Network declined $588 million, or 35.9%,
compared to 2007, primarily as a result of higher provision for loan loss expense. Comparing 2007 to 2006, net
income in the Banking Network increased $86 million, or 5.5%.
Net interest income for the Banking Network totaled $3.2 billion in 2008 compared to $3.4 billion in 2007. The
decline in the net interest income was primarily due to lower interest income on loans due to the decline in the
prime rate that began in late 2007 and continued through 2008. Net interest income earned for 2007 increased by
$130 million, or 3.9%, compared to 2006. The increase in net interest income during 2007 was primarily a result of
an increase of $210 million in the net funds transfer pricing (“FTP”) credit provided to the Banking Network
during 2007, offset by a decrease of $80 million in net interest income from clients. The decline in the net interest
income from clients in 2007 compared to 2006 was primarily due to higher interest expense on deposits due to a
shift by clients to higher cost products and growth in CDs.
The economic provision for loan and lease losses increased $685 million in 2008 compared to 2007, reflecting
the deterioration in the residential acquisition and development portfolio, as well as growth in outstanding loans.
The economic provision for loan and lease losses increased $10 million, or 6.9%, from 2006 to 2007. The increase
during 2007 primarily reflected loan growth.
Noninterest income in the Banking Network increased $140 million, or 12.8%, during 2008, and $128 million,
or 13.2% during 2007. The growth in noninterest income for 2008 and 2007 was primarily due to growth in
overdraft fees, checkcard fees and other nondeposit fees and commissions. Noninterest income allocated from
other segments, which is reflected as intersegment net referral fees (“referral fees”), increased $15 million, or
6.3%, compared to 2007, primarily due to higher referrals for mortgage lending. Referral fees increased $16
million, or 7.2%, compared to 2006, primarily due to higher referrals from the Financial Services segment.
Noninterest expenses incurred within the Banking Network during 2008 increased $73 million, or 5.0%, compared
to 2007. Comparing 2007 to 2006, noninterest expenses increased $70 million, or 5.0%, including additional costs
related to the acquisition of Coastal. Allocated corporate expenses increased $112 million, or 19.0%, in 2008
primarily due to increased allocations for certain corporate overhead functions that were previously not allocated
to the business units, and increases for loan administration expense, IT services and operations. The increase
related to loan administration expense was the result in a change in the methodology for allocating these
expenses between business segments. Comparing 2007 to 2006, allocated corporate expenses increased $60
million because of increased allocations of marketing and advertising expenses and other corporate support areas.
74