BB&T 2008 Annual Report Download - page 66
Download and view the complete annual report
Please find page 66 of the 2008 BB&T annual report below. You can navigate through the pages in the report by either clicking on the pages listed below, or by using the keyword search tool below to find specific information within the annual report.-
 1
1 -
2
-
3
-
4
-
5
-
6
-
7
-
8
-
9
-
10
-
11
-
12
-
13
-
14
-
15
-
16
-
17
-
18
-
19
-
20
-
21
-
22
-
23
-
24
-
25
-
26
-
27
-
28
-
29
-
30
-
31
-
32
-
33
-
34
-
35
-
36
-
37
-
38
-
39
-
40
-
41
-
42
-
43
-
44
-
45
-
46
-
47
-
48
-
49
-
50
-
51
-
52
-
53
-
54
-
55
-
 56
56 -
 57
57 -
 58
58 -
 59
59 -
 60
60 -
 61
61 -
 62
62 -
 63
63 -
 64
64 -
 65
65 -
 66
66 -
 67
67 -
 68
68 -
 69
69 -
 70
70 -
 71
71 -
 72
72 -
 73
73 -
 74
74 -
 75
75 -
 76
76 -
77
-
78
-
79
-
80
-
81
-
82
-
83
-
84
-
85
-
86
-
87
-
88
-
89
-
90
-
91
-
92
-
93
-
94
-
95
-
96
-
97
-
98
-
99
-
100
-
101
-
102
-
103
-
104
-
105
-
106
-
107
-
108
-
109
-
110
-
111
-
112
-
113
-
114
-
115
-
116
-
117
-
118
-
119
-
120
-
121
-
122
-
123
-
124
-
125
-
126
-
127
-
128
-
129
-
130
-
131
-
132
-
133
-
134
-
135
-
136
-
137
-
138
-
139
-
140
-
141
-
142
-
143
-
144
-
145
-
146
-
147
-
148
-
149
-
150
-
151
-
152
 |
 |

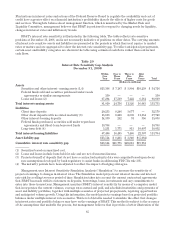
sensitivity of earnings to changes in interest rates than other analyses such as static or dynamic gap. In addition
to Simulation analysis, BB&T uses Economic Value of Equity (“EVE”) analysis to focus on changes in capital
given potential changes in interest rates. This measure also allows BB&T to analyze interest rate risk that falls
outside the analysis window contained in the Simulation model. The EVE model is a discounted cash flow of the
entire portfolio of BB&T’s assets, liabilities, and derivatives instruments. The difference in the present value of
assets minus the present value of liabilities is defined as the economic value of the Banks’ equity.
The asset/liability management process requires a number of key assumptions. Management determines the
most likely outlook for the economy and interest rates by analyzing external factors, including published
economic projections and data, the effects of likely monetary and fiscal policies, as well as any enacted or
prospective regulatory changes. BB&T’s current and prospective liquidity position, current balance sheet
volumes and projected growth, accessibility of funds for short-term needs and capital maintenance are also
considered. This data is combined with various interest rate scenarios to provide management with the
information necessary to analyze interest sensitivity and to aid in the development of strategies to reach
performance goals.
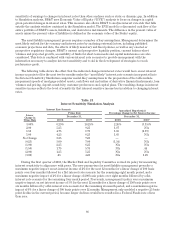
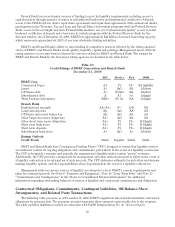
The following table shows the effect that the indicated changes in interest rates would have on net interest
income as projected for the next twelve months under the “most likely” interest rate scenario incorporated into
the Interest Sensitivity Simulation computer model. Key assumptions in the preparation of the table include
prepayment speeds of mortgage-related assets, cash flows and maturities of derivative financial instruments, loan
volumes and pricing, deposit sensitivity, customer preferences and capital plans. The resulting change in interest
sensitive income reflects the level of sensitivity that interest sensitive income has in relation to changing interest
rates.
Table 21
Interest Sensitivity Simulation Analysis
Interest Rate Scenario Annualized Hypothetical
Percentage Change in Net Interest Income
Linear
Change in
Prime Rate
Prime Rate
December 31, December 31,
2008 2007 2008 2007
3.00% 6.25% 10.25% 2.26% (3.15)%
2.00 5.25 9.25 1.87 NA
1.50 4.75 8.75 1.85 (2.19)
1.00 4.25 8.25 1.65 NA
No Change 3.25 7.25 — —
(0.25) 3.00 7.00 (1.54) NA
(1.00) 2.25 6.25 NA NA
(1.50) 1.75 5.75 NA .44
(2.00) 1.25 5.25 NA NA
(3.00) .25 4.25 NA 1.29
During the first quarter of 2008, the Market Risk and Liquidity Committee revised its policy for measuring
interest sensitivity to align more with peers. The new parameters for asset/liability management prescribe a
maximum negative impact on net interest income of 2% for the next 12 months for a linear change of 100 basis
points over four months followed by a flat interest rate scenario for the remaining eight month period, and a
maximum negative impact of 4% for a linear change of 200 basis points over eight months followed by a flat
interest rate scenario for the remaining four month period. Previously, management’s policy was a maximum
negative impact on net interest income of 3% for the next 12 months for a linear change of 150 basis points over
six months followed by a flat interest rate scenario for the remaining six month period, and a maximum negative
impact of 6% for a linear change of 300 basis points over 12 months. Management only modeled a negative 25 basis
point decline in the current period, because larger declines would have resulted in a Federal Funds rate of less
than zero.
66