BB&T 2008 Annual Report Download - page 45
Download and view the complete annual report
Please find page 45 of the 2008 BB&T annual report below. You can navigate through the pages in the report by either clicking on the pages listed below, or by using the keyword search tool below to find specific information within the annual report.-
 1
1 -
2
-
3
-
4
-
5
-
6
-
7
-
8
-
9
-
10
-
11
-
12
-
13
-
14
-
15
-
16
-
17
-
18
-
19
-
20
-
21
-
22
-
23
-
24
-
25
-
26
-
27
-
28
-
29
-
30
-
31
-
32
-
33
-
34
-
 35
35 -
 36
36 -
 37
37 -
 38
38 -
 39
39 -
 40
40 -
 41
41 -
 42
42 -
 43
43 -
 44
44 -
 45
45 -
 46
46 -
 47
47 -
 48
48 -
 49
49 -
 50
50 -
 51
51 -
 52
52 -
 53
53 -
 54
54 -
 55
55 -
56
-
57
-
58
-
59
-
60
-
61
-
62
-
63
-
64
-
65
-
66
-
67
-
68
-
69
-
70
-
71
-
72
-
73
-
74
-
75
-
76
-
77
-
78
-
79
-
80
-
81
-
82
-
83
-
84
-
85
-
86
-
87
-
88
-
89
-
90
-
91
-
92
-
93
-
94
-
95
-
96
-
97
-
98
-
99
-
100
-
101
-
102
-
103
-
104
-
105
-
106
-
107
-
108
-
109
-
110
-
111
-
112
-
113
-
114
-
115
-
116
-
117
-
118
-
119
-
120
-
121
-
122
-
123
-
124
-
125
-
126
-
127
-
128
-
129
-
130
-
131
-
132
-
133
-
134
-
135
-
136
-
137
-
138
-
139
-
140
-
141
-
142
-
143
-
144
-
145
-
146
-
147
-
148
-
149
-
150
-
151
-
152
 |
 |

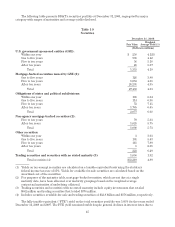
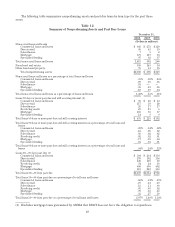
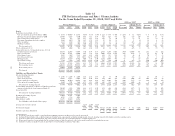
The following table presents BB&T’s securities portfolio at December 31, 2008, segregated by major
category with ranges of maturities and average yields disclosed.
Table 10
Securities
December 31, 2008
Fair Value Weighted
Average Yield (1)
(Dollars in millions)
U.S. government-sponsored entities (GSE):
Within one year $ 258 4.12%
One to five years 998 4.12
Five to ten years 56 5.18
After ten years 21 5.87
Total 1,333 4.19
Mortgage-backed securities issued by GSE (2):
One to five years 126 3.80
Five to ten years 1,053 4.38
After ten years 26,251 4.85
Total 27,430 4.83
Obligations of states and political subdivisions:
Within one year 106 6.84
One to five years 114 6.88
Five to ten years 72 7.15
After ten years 1,785 6.65
Total 2,077 6.68
Non-agency mortgage-backed securities (2):
Five to ten years 70 5.33
After ten years 1,028 5.75
Total 1,098 5.73
Other securities:
Within one year 3 3.63
One to five years 101 5.03
Five to ten years 111 7.89
After ten years 8 2.61
Total 223 6.29
Trading securities and securities with no stated maturity (3) 1,058 1.82
Total securities (4) $33,219 4.89
(1) Yields on tax-exempt securities are calculated on a taxable-equivalent basis using the statutory
federal income tax rate of 35%. Yields for available-for-sale securities are calculated based on the
amortized cost of the securities.
(2) For purposes of the maturity table, mortgage-backed securities, which are not due at a single
maturity date, have been allocated over maturity groupings based on the weighted average
contractual maturities of underlying collateral.
(3) Trading securities and securities with no stated maturity include equity investments that totaled
$682 million and trading securities that totaled $376 million.
(4) Includes securities available-for-sale and trading securities of $32.8 billion and $376 million, respectively.
The fully taxable equivalent (“FTE”) yield on the total securities portfolio was 5.05% for the years ended
December 31, 2008 and 2007. The FTE yield remained stable despite general declines in interest rates due to
45