BB&T 2008 Annual Report Download - page 136
Download and view the complete annual report
Please find page 136 of the 2008 BB&T annual report below. You can navigate through the pages in the report by either clicking on the pages listed below, or by using the keyword search tool below to find specific information within the annual report.-
 1
1 -
2
-
3
-
4
-
5
-
6
-
7
-
8
-
9
-
10
-
11
-
12
-
13
-
14
-
15
-
16
-
17
-
18
-
19
-
20
-
21
-
22
-
23
-
24
-
25
-
26
-
27
-
28
-
29
-
30
-
31
-
32
-
33
-
34
-
35
-
36
-
37
-
38
-
39
-
40
-
41
-
42
-
43
-
44
-
45
-
46
-
47
-
48
-
49
-
50
-
51
-
52
-
53
-
54
-
55
-
56
-
57
-
58
-
59
-
60
-
61
-
62
-
63
-
64
-
65
-
66
-
67
-
68
-
69
-
70
-
71
-
72
-
73
-
74
-
75
-
76
-
77
-
78
-
79
-
80
-
81
-
82
-
83
-
84
-
85
-
86
-
87
-
88
-
89
-
90
-
91
-
92
-
93
-
94
-
95
-
96
-
97
-
98
-
99
-
100
-
101
-
102
-
103
-
104
-
105
-
106
-
107
-
108
-
109
-
110
-
111
-
112
-
113
-
114
-
115
-
116
-
117
-
118
-
119
-
120
-
121
-
122
-
123
-
124
-
125
-
 126
126 -
 127
127 -
 128
128 -
 129
129 -
 130
130 -
 131
131 -
 132
132 -
 133
133 -
 134
134 -
 135
135 -
 136
136 -
 137
137 -
 138
138 -
 139
139 -
 140
140 -
 141
141 -
 142
142 -
 143
143 -
 144
144 -
 145
145 -
 146
146 -
147
-
148
-
149
-
150
-
151
-
152
 |
 |

BB&T CORPORATION AND SUBSIDIARIES
NOTES TO CONSOLIDATED FINANCIAL STATEMENTS—(Continued)
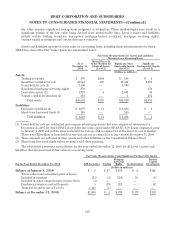
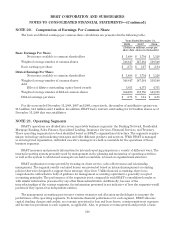
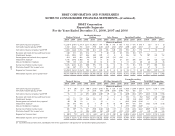
NOTE 20. Computation of Earnings Per Common Share
The basic and diluted earnings per common share calculations are presented in the following table:
Years Ended December 31,
2008 2007 2006
(Dollars in millions, except per
share data, shares in thousands)
Basic Earnings Per Share:
Net income available to common shareholders $ 1,498 $ 1,734 $ 1,528
Weighted average number of common shares 548,847 547,184 539,140
Basic earnings per share $ 2.73 $ 3.17 $ 2.84
Diluted Earnings Per Share:
Net income available to common shareholders $ 1,498 $ 1,734 $ 1,528
Weighted average number of common shares 548,847 547,184 539,140
Add:
Effect of dilutive outstanding equity-based awards 3,651 4,571 4,751
Weighted average number of diluted common shares 552,498 551,755 543,891
Diluted earnings per share $ 2.71 $ 3.14 $ 2.81
For the years ended December 31, 2008, 2007 and 2006, respectively, the number of antidilutive options was
33.5 million, 14.0 million and 8.1 million. In addition, BB&T had a warrant outstanding for 13.9 million shares as of
December 31, 2008 that was antidilutive.
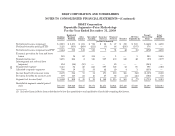
NOTE 21. Operating Segments
BB&T’s operations are divided into seven reportable business segments: the Banking Network, Residential
Mortgage Banking, Sales Finance, Specialized Lending, Insurance Services, Financial Services, and Treasury.
These operating segments have been identified based on BB&T’s organizational structure. The segments require
unique technology and marketing strategies and offer different products and services. While BB&T is managed
as an integrated organization, individual executive managers are held accountable for the operations of these
business segments.
BB&T measures and presents information for internal reporting purposes in a variety of different ways. The
internal reporting system presently used by management in the planning and measuring of operating activities,
as well as the system to which most managers are held accountable, is based on organizational structure.
BB&T emphasizes revenue growth by focusing on client service, sales effectiveness and relationship
management. The segment results contained herein are presented based on internal management accounting
policies that were designed to support these strategic objectives. Unlike financial accounting, there is no
comprehensive authoritative body of guidance for management accounting equivalent to generally accepted
accounting principles. The performance of the segments is not comparable with BB&T’s consolidated results or
with similar information presented by any other financial institution. Additionally, because of the
interrelationships of the various segments, the information presented is not indicative of how the segments would
perform if they operated as independent entities.
The management accounting process uses various estimates and allocation methodologies to measure the
performance of the operating segments. To determine financial performance for each segment, BB&T allocates
capital, funding charges and credits, an economic provision for loan and lease losses, certain noninterest expenses
and income tax provisions to each segment, as applicable. Also, to promote revenue growth and provide a basis
136