BB&T 2008 Annual Report Download - page 50
Download and view the complete annual report
Please find page 50 of the 2008 BB&T annual report below. You can navigate through the pages in the report by either clicking on the pages listed below, or by using the keyword search tool below to find specific information within the annual report.-
 1
1 -
2
-
3
-
4
-
5
-
6
-
7
-
8
-
9
-
10
-
11
-
12
-
13
-
14
-
15
-
16
-
17
-
18
-
19
-
20
-
21
-
22
-
23
-
24
-
25
-
26
-
27
-
28
-
29
-
30
-
31
-
32
-
33
-
34
-
35
-
36
-
37
-
38
-
39
-
 40
40 -
 41
41 -
 42
42 -
 43
43 -
 44
44 -
 45
45 -
 46
46 -
 47
47 -
 48
48 -
 49
49 -
 50
50 -
 51
51 -
 52
52 -
 53
53 -
 54
54 -
 55
55 -
 56
56 -
 57
57 -
 58
58 -
 59
59 -
 60
60 -
61
-
62
-
63
-
64
-
65
-
66
-
67
-
68
-
69
-
70
-
71
-
72
-
73
-
74
-
75
-
76
-
77
-
78
-
79
-
80
-
81
-
82
-
83
-
84
-
85
-
86
-
87
-
88
-
89
-
90
-
91
-
92
-
93
-
94
-
95
-
96
-
97
-
98
-
99
-
100
-
101
-
102
-
103
-
104
-
105
-
106
-
107
-
108
-
109
-
110
-
111
-
112
-
113
-
114
-
115
-
116
-
117
-
118
-
119
-
120
-
121
-
122
-
123
-
124
-
125
-
126
-
127
-
128
-
129
-
130
-
131
-
132
-
133
-
134
-
135
-
136
-
137
-
138
-
139
-
140
-
141
-
142
-
143
-
144
-
145
-
146
-
147
-
148
-
149
-
150
-
151
-
152
 |
 |

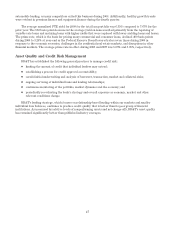
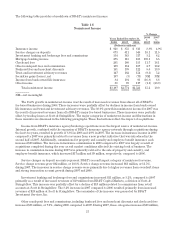
Allowance for Loan and Lease Losses and Reserve for Unfunded Lending Commitments
The allowance for loan and lease losses and the reserve for unfunded lending commitments compose BB&T’s
allowance for credit losses. The allowance for credit losses totaled $1.6 billion at December 31, 2008, an increase of
58.3% compared to $1.0 billion at the end of 2007. The allowance for loan and lease losses, as a percentage of loans
and leases held for investment, was 1.62% at December 31, 2008, compared to 1.10% at year-end 2007. The
allowance for credit losses increased by $592 million during 2008, primarily as a result of higher loss rates for
residential real estate related lending, and their effect on the overall allowance model. The increase of $592
million included an increase of $570 million in the allowance for loan and lease losses and $22 million in the reserve
for unfunded lending commitments. These increases resulted from increased migration of loans and lending
commitments to higher risk grades, with the most significant increases occurring in the single family residential
real estate acquisition, development and construction loan portfolio. Please refer to Note 5 “Allowance for Loan
and Lease Losses and Reserve for Unfunded Lending Commitments” in the “Notes to Consolidated Financial
Statements” for additional disclosures.
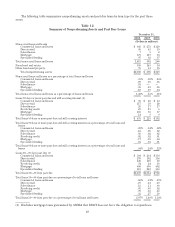
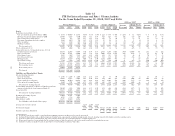
Information relevant to BB&T’s allowance for loan and lease losses for the last five years is presented in the
following table. The table is presented using regulatory classifications.
Table 13
Analysis of Allowance for Credit Losses
December 31,
2008 2007 2006 2005 2004
(Dollars in millions)
Balance, beginning of period $ 1,015 $ 888 $ 830 $ 828 $ 793
Charge-offs:
Commercial, financial and agricultural (94) (40) (32) (52) (60)
Real estate (427) (93) (46) (45) (61)
Consumer (383) (264) (194) (174) (165)
Lease receivables (13) (8) (5) (6) (11)
Total charge-offs (917) (405) (277) (277) (297)
Recoveries:
Commercial, financial and agricultural 10 11 12 14 17
Real estate 887810
Consumer 47 47 41 39 34
Lease receivables 11121
Total recoveries 66 67 61 63 62
Net charge-offs (851) (338) (216) (214) (235)
Provision charged to expense 1,445 448 240 217 249
Allowance for loans (sold) acquired, net (2) 17 34 (1) 21
Balance, end of period $ 1,607 $ 1,015 $ 888 $ 830 $ 828
Average loans and leases (1) $95,195 $87,952 $79,313 $71,517 $66,107
Net charge-offs as a percentage of average loans and leases (1) .89% .38% .27% .30% .36%
(1) Loans and leases are net of unearned income and include loans held for sale.
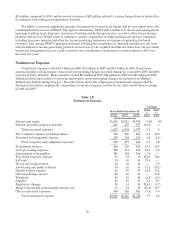
Deposits and Other Borrowings
Client deposits generated through the BB&T banking network are the largest source of funds used to
support asset growth. Total deposits at December 31, 2008, were $98.6 billion, an increase of $11.8 billion, or
13.7%, compared to year-end 2007. The increase in deposits during 2008 was driven by a $5.0 billion, or 49.9%,
increase in other interest-bearing deposits and a $3.9 billion, or 11.0%, increase in other client deposits, which
50