BB&T 2008 Annual Report Download - page 43
Download and view the complete annual report
Please find page 43 of the 2008 BB&T annual report below. You can navigate through the pages in the report by either clicking on the pages listed below, or by using the keyword search tool below to find specific information within the annual report.-
 1
1 -
2
-
3
-
4
-
5
-
6
-
7
-
8
-
9
-
10
-
11
-
12
-
13
-
14
-
15
-
16
-
17
-
18
-
19
-
20
-
21
-
22
-
23
-
24
-
25
-
26
-
27
-
28
-
29
-
30
-
31
-
32
-
 33
33 -
 34
34 -
 35
35 -
 36
36 -
 37
37 -
 38
38 -
 39
39 -
 40
40 -
 41
41 -
 42
42 -
 43
43 -
 44
44 -
 45
45 -
 46
46 -
 47
47 -
 48
48 -
 49
49 -
 50
50 -
 51
51 -
 52
52 -
 53
53 -
54
-
55
-
56
-
57
-
58
-
59
-
60
-
61
-
62
-
63
-
64
-
65
-
66
-
67
-
68
-
69
-
70
-
71
-
72
-
73
-
74
-
75
-
76
-
77
-
78
-
79
-
80
-
81
-
82
-
83
-
84
-
85
-
86
-
87
-
88
-
89
-
90
-
91
-
92
-
93
-
94
-
95
-
96
-
97
-
98
-
99
-
100
-
101
-
102
-
103
-
104
-
105
-
106
-
107
-
108
-
109
-
110
-
111
-
112
-
113
-
114
-
115
-
116
-
117
-
118
-
119
-
120
-
121
-
122
-
123
-
124
-
125
-
126
-
127
-
128
-
129
-
130
-
131
-
132
-
133
-
134
-
135
-
136
-
137
-
138
-
139
-
140
-
141
-
142
-
143
-
144
-
145
-
146
-
147
-
148
-
149
-
150
-
151
-
152
 |
 |

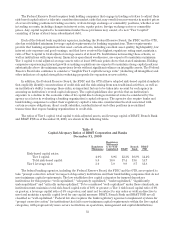
The compound annual rate of growth in average total assets for the five-year period ended December 31,
2008, was 9.9%. Over the same five-year period, average loans and leases increased at a compound annual rate of
10.5%, average securities increased at a compound annual rate of 7.5%, and average deposits grew at a compound
annual rate of 9.3%. These balance sheet growth rates include the effect of acquisitions, as well as internal
growth.
For more detailed discussions concerning the causes of these fluctuations, please refer to the sections that
follow.
Securities
The securities portfolio provides earnings and liquidity, and is managed as part of the overall asset and
liability management process to optimize net interest income and reduce exposure to interest rate risk.
Management has historically emphasized investments with duration of five years or less to provide flexibility in
managing the balance sheet in changing interest rate environments. Total securities increased 41.8% from
year-end 2007 to year-end 2008, to a total of $33.2 billion at December 31, 2008. The growth in the securities
portfolio reflects the initial deployment of the capital invested by the Treasury Department in connection with
the CPP. The purchase of additional securities at year-end 2008 was the most efficient and effective means of
deploying the capital investment by the Treasury Department. It is anticipated that cash flows from pay downs
and maturities from the securities portfolio will be reinvested into loans during 2009, and the overall size of the
securities portfolio will eventually decline to a more traditional level.
As of December 31, 2008, the total securities portfolio included $376 million in trading securities and $32.8
billion of available-for-sale securities. The available-for-sale portfolio comprised 98.9% of total securities at
December 31, 2008. Management believes that the high concentration of securities in the available-for-sale
portfolio allows flexibility in the management of the overall investment portfolio, consistent with the objectives of
optimizing profitability, mitigating interest rate risk, supporting capital and providing liquidity.
The following table provides information regarding the composition of BB&T’s securities portfolio for the
years presented:
Table 9
Composition of Securities Portfolio
December 31,
2008 2007 2006
(Dollars in millions)
Trading securities: $ 376 $ 1,009 $ 2,147
Securities available for sale:
U.S. government-sponsored entities (GSE) 1,333 9,807 9,119
Mortgage-backed securities issued by GSE 27,430 8,221 8,297
States and political subdivisions 2,077 1,392 571
Non-agency mortgage-backed securities 1,098 1,720 1,571
Equity and other securities 905 1,279 1,163
Total securities available for sale 32,843 22,419 20,721
Total securities $33,219 $23,428 $22,868
At December 31, 2008, trading securities reflected on BB&T’s consolidated balance sheet totaled $376 million
compared to $1.0 billion at December 31, 2007. The decline in the trading portfolio was largely the result of a
reduction in Scott & Stringfellow’s trading inventory primarily due to management’s decision to reduce risk
associated with trading activities.
43