BB&T 2008 Annual Report Download - page 114
Download and view the complete annual report
Please find page 114 of the 2008 BB&T annual report below. You can navigate through the pages in the report by either clicking on the pages listed below, or by using the keyword search tool below to find specific information within the annual report.-
 1
1 -
2
-
3
-
4
-
5
-
6
-
7
-
8
-
9
-
10
-
11
-
12
-
13
-
14
-
15
-
16
-
17
-
18
-
19
-
20
-
21
-
22
-
23
-
24
-
25
-
26
-
27
-
28
-
29
-
30
-
31
-
32
-
33
-
34
-
35
-
36
-
37
-
38
-
39
-
40
-
41
-
42
-
43
-
44
-
45
-
46
-
47
-
48
-
49
-
50
-
51
-
52
-
53
-
54
-
55
-
56
-
57
-
58
-
59
-
60
-
61
-
62
-
63
-
64
-
65
-
66
-
67
-
68
-
69
-
70
-
71
-
72
-
73
-
74
-
75
-
76
-
77
-
78
-
79
-
80
-
81
-
82
-
83
-
84
-
85
-
86
-
87
-
88
-
89
-
90
-
91
-
92
-
93
-
94
-
95
-
96
-
97
-
98
-
99
-
100
-
101
-
102
-
103
-
 104
104 -
 105
105 -
 106
106 -
 107
107 -
 108
108 -
 109
109 -
 110
110 -
 111
111 -
 112
112 -
 113
113 -
 114
114 -
 115
115 -
 116
116 -
 117
117 -
 118
118 -
 119
119 -
 120
120 -
 121
121 -
 122
122 -
 123
123 -
 124
124 -
125
-
126
-
127
-
128
-
129
-
130
-
131
-
132
-
133
-
134
-
135
-
136
-
137
-
138
-
139
-
140
-
141
-
142
-
143
-
144
-
145
-
146
-
147
-
148
-
149
-
150
-
151
-
152
 |
 |

BB&T CORPORATION AND SUBSIDIARIES
NOTES TO CONSOLIDATED FINANCIAL STATEMENTS—(Continued)
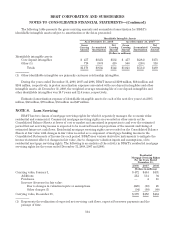
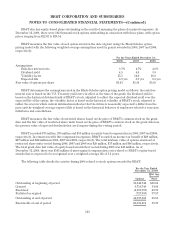
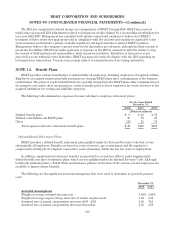
The following tables summarize information about BB&T’s stock option awards as of December 31, 2008:
Options Outstanding Options Exercisable
Range of
Exercise Prices
Number
Outstanding
12/31/08
Weighted-
Average
Remaining
Contractual
Life (yrs)
Weighted-
Average
Exercise
Price
Number
Exercisable
12/31/08
Weighted-
Average
Remaining
Contractual
Life (yrs)
Weighted-
Average
Exercise
Price
$ 8.11 to $10.00 22,055 1.8 $ 8.58 22,055 1.8 $ 8.58
10.01 to 15.00 87,380 2.0 12.07 87,380 2.0 12.07
15.01 to 25.00 1,975,759 2.1 23.53 1,780,189 1.3 23.40
25.01 to 35.00 11,483,116 6.8 33.27 5,649,094 4.3 32.23
35.01 to 45.00 28,223,420 5.6 38.88 19,048,919 4.9 38.03
45.01 to 50.71 45,774 1.0 48.05 45,774 1.0 48.05
41,837,504 5.7 36.55 26,633,411 4.5 35.73
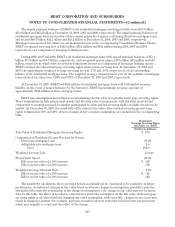
Options Expected to Vest
Range of
Exercise Prices
Number
Outstanding
12/31/08
Weighted-
Average
Remaining
Contractual
Life (yrs)
Weighted-
Average
Exercise
Price
$ 8.11 to $10.00 22,055 1.8 $ 8.58
10.01 to 15.00 87,380 2.0 12.07
15.01 to 25.00 1,936,645 2.0 23.50
25.01 to 35.00 10,330,683 6.5 33.16
35.01 to 45.00 26,372,913 5.4 38.70
45.01 to 50.71 45,774 1.0 48.05
38,795,450 5.5 36.40
The aggregate intrinsic value of options outstanding, options exercisable and options expected to vest at
December 31, 2008 was $10 million, $9 million, and $10 million, respectively.
The following table details the activity during 2008 related to restricted shares and restricted share units
awarded by BB&T:
For the Year Ended
December 31, 2008
Shares/Units
Wtd. Avg.
Grant Date
Fair Value
Nonvested at beginning of period 3,994,441 $33.20
Granted 2,610,672 23.08
Vested (105,300) 30.57
Forfeited (240,464) 29.70
Nonvested at end of period 6,259,349 29.15
At December 31, 2008, BB&T’s restricted shares and restricted share units had a weighted-average life of 3.2
years. At December 31, 2008, management estimates that 5.4 million restricted shares and restricted share units
will vest over a weighted-average life of 3.2 years.
114