BB&T 2008 Annual Report Download - page 60
Download and view the complete annual report
Please find page 60 of the 2008 BB&T annual report below. You can navigate through the pages in the report by either clicking on the pages listed below, or by using the keyword search tool below to find specific information within the annual report.-
 1
1 -
2
-
3
-
4
-
5
-
6
-
7
-
8
-
9
-
10
-
11
-
12
-
13
-
14
-
15
-
16
-
17
-
18
-
19
-
20
-
21
-
22
-
23
-
24
-
25
-
26
-
27
-
28
-
29
-
30
-
31
-
32
-
33
-
34
-
35
-
36
-
37
-
38
-
39
-
40
-
41
-
42
-
43
-
44
-
45
-
46
-
47
-
48
-
49
-
 50
50 -
 51
51 -
 52
52 -
 53
53 -
 54
54 -
 55
55 -
 56
56 -
 57
57 -
 58
58 -
 59
59 -
 60
60 -
 61
61 -
 62
62 -
 63
63 -
 64
64 -
 65
65 -
 66
66 -
 67
67 -
 68
68 -
 69
69 -
 70
70 -
71
-
72
-
73
-
74
-
75
-
76
-
77
-
78
-
79
-
80
-
81
-
82
-
83
-
84
-
85
-
86
-
87
-
88
-
89
-
90
-
91
-
92
-
93
-
94
-
95
-
96
-
97
-
98
-
99
-
100
-
101
-
102
-
103
-
104
-
105
-
106
-
107
-
108
-
109
-
110
-
111
-
112
-
113
-
114
-
115
-
116
-
117
-
118
-
119
-
120
-
121
-
122
-
123
-
124
-
125
-
126
-
127
-
128
-
129
-
130
-
131
-
132
-
133
-
134
-
135
-
136
-
137
-
138
-
139
-
140
-
141
-
142
-
143
-
144
-
145
-
146
-
147
-
148
-
149
-
150
-
151
-
152
 |
 |

$15 million compared to 2006, and decreased revenues of $11 million related to various financial assets isolated for
the purpose of providing post-employment benefits.
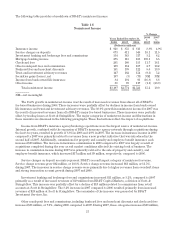
The ability to generate significant amounts of noninterest revenue in the future will be very important to the
continued financial success of BB&T. Through its subsidiaries, BB&T will continue to focus on asset management,
mortgage banking, trust, insurance, investment banking and brokerage services, as well as other fee-producing
products and services. BB&T plans to continue to pursue acquisitions of additional financial services companies,
including insurance agencies and other fee income producing businesses as a means of expanding fee-based
revenues. Also, among BB&T’s principal strategies following the acquisition of a financial institution is the cross-
sell of noninterest income generating products and services to the acquired institution’s client base. As previously
mentioned, management has set a goal to increase the contribution of noninterest revenue sources to 45% over
the next few years.
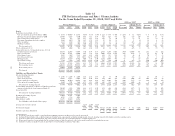
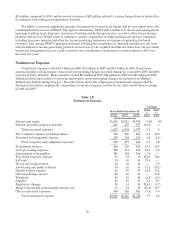
Noninterest Expense
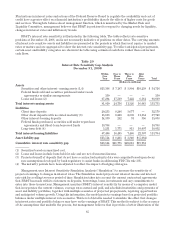
Noninterest expense totaled $3.9 billion in 2008, $3.6 billion in 2007 and $3.5 billion in 2006. Noninterest
expense includes certain merger-related and restructuring charges recorded during the years 2008, 2007 and 2006
as noted in Table 18 below. These amounts totaled $15 million in 2008, $21 million in 2007 and $18 million in 2006.
Additional disclosures related to these merger-related and restructuring charges are presented in “Merger-
Related and Restructuring Charges.” The table below shows the components of noninterest expense and the
discussion that follows explains the composition of certain categories and the factors that caused them to change
in 2008 and 2007.
Table 18
Noninterest Expense
Years Ended December 31,
% Change
2008
v.
2007
2007
v.
20062008 2007 2006
(Dollars in millions)
Salaries and wages $1,863 $1,715 $1,700 8.6% .9%
Pension and other employee benefits 338 379 377 (10.8) .5
Total personnel expenses 2,201 2,094 2,077 5.1 .8
Net occupancy expense on bank premises 310 286 253 8.4 13.0
Furniture and equipment expense 199 191 196 4.2 (2.6)
Total occupancy and equipment expenses 509 477 449 6.7 6.2
Professional services 200 139 120 43.9 15.8
Loan processing expenses 125 111 103 12.6 7.8
Amortization of intangibles 100 104 104 (3.8) —
Foreclosed property expense 79 31 18 154.8 72.2
Software 74 58 58 27.6 —
Travel and transportation 52 52 48 — 8.3
Advertising and public relations 50 45 55 11.1 (18.2)
Deposit related expense 49 43 38 14.0 13.2
Other marketing expense 46 46 30 — 53.3
Telephone 42 43 44 (2.3) (2.3)
Supplies 40 38 37 5.3 2.7
Regulatory charges 30 14 15 114.3 (6.7)
Merger-related and restructuring charges, net 15 21 18 (28.6) 16.7
Other noninterest expenses 309 320 302 (3.4) 6.0
Total noninterest expense $3,921 $3,636 $3,516 7.8 3.4
60