BB&T 2008 Annual Report Download - page 24
Download and view the complete annual report
Please find page 24 of the 2008 BB&T annual report below. You can navigate through the pages in the report by either clicking on the pages listed below, or by using the keyword search tool below to find specific information within the annual report.-
 1
1 -
2
-
3
-
4
-
5
-
6
-
7
-
8
-
9
-
10
-
11
-
12
-
13
-
 14
14 -
 15
15 -
 16
16 -
 17
17 -
 18
18 -
 19
19 -
 20
20 -
 21
21 -
 22
22 -
 23
23 -
 24
24 -
 25
25 -
 26
26 -
 27
27 -
 28
28 -
 29
29 -
 30
30 -
 31
31 -
 32
32 -
 33
33 -
 34
34 -
35
-
36
-
37
-
38
-
39
-
40
-
41
-
42
-
43
-
44
-
45
-
46
-
47
-
48
-
49
-
50
-
51
-
52
-
53
-
54
-
55
-
56
-
57
-
58
-
59
-
60
-
61
-
62
-
63
-
64
-
65
-
66
-
67
-
68
-
69
-
70
-
71
-
72
-
73
-
74
-
75
-
76
-
77
-
78
-
79
-
80
-
81
-
82
-
83
-
84
-
85
-
86
-
87
-
88
-
89
-
90
-
91
-
92
-
93
-
94
-
95
-
96
-
97
-
98
-
99
-
100
-
101
-
102
-
103
-
104
-
105
-
106
-
107
-
108
-
109
-
110
-
111
-
112
-
113
-
114
-
115
-
116
-
117
-
118
-
119
-
120
-
121
-
122
-
123
-
124
-
125
-
126
-
127
-
128
-
129
-
130
-
131
-
132
-
133
-
134
-
135
-
136
-
137
-
138
-
139
-
140
-
141
-
142
-
143
-
144
-
145
-
146
-
147
-
148
-
149
-
150
-
151
-
152
 |
 |

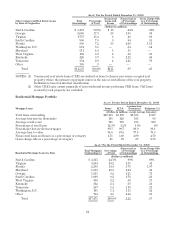
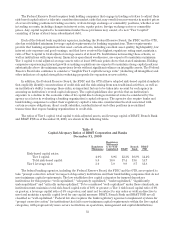
As of / For the Period Ended December 31, 2008
Other Commercial Real Estate Loans
by State of Origination Total
Outstandings Percentage
of Total
Nonaccrual
Loans and
Leases
Nonaccrual as
a Percentage
of Outstandings
Gross Charge-Offs
as a Percentage
of Outstandings
(Dollars in millions)
North Carolina $ 3,457 30.1% $ 15 .44% .09%
Georgia 2,068 17.9 28 1.35 .36
Virginia 1,777 15.4 8 .46 .06
South Carolina 900 7.8 9 .94 .13
Florida 830 7.2 35 4.20 1.61
Washington, D.C. 674 5.8 — .04 .04
Maryland 511 4.4 1 .15 —
West Virginia 452 3.9 2 .52 .03
Kentucky 426 3.7 9 2.12 .04
Tennessee 334 2.9 4 1.25 .70
Other 108 .9 — — —
Total $11,537 100.0% $111 .97 .25
NOTES: (1) Commercial real estate loans (CRE) are defined as loans to finance non-owner occupied real
property where the primary repayment source is the sale or rental/lease of the real property.
Definition is based on internal classification.
(2) Other CRE loans consist primarily of non-residential income producing CRE loans. C&I loans
secured by real property are excluded.
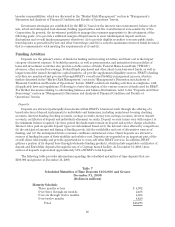
Residential Mortgage Portfolio
As of / For the Period Ended December 31, 2008
Mortgage Loans Prime ALT-A Construction/
Permanent Subprime (1)
(Dollars in millions, except average loan size)
Total loans outstanding $12,103 $3,193 $1,538 $ 637
Average loan size (in thousands) 195 329 335 69
Average credit score 721 735 735 590
Percentage of total loans 12.3% 3.2% 1.6% .6%
Percentage that are first mortgages 99.7 99.7 98.9 83.1
Average loan to value 74.6 67.5 77.8 75.3
Nonaccrual loans and leases as a percentage of category 1.51 3.08 4.99 4.70
Gross charge-offs as a percentage of category .41 .70 .87 2.19
As of / For the Period Ended December 31, 2008
Residential Mortgage Loans by State Total Mortgages
Outstanding (1) Percentage
of Total
Nonaccrual as
a Percentage
of Outstandings
Gross Charge-Offs
as a Percentage
of Outstandings
(Dollars in millions)
North Carolina $ 4,315 24.7% .99% .09%
Virginia 3,534 20.2 1.81 .41
Florida 2,589 14.8 5.78 1.97
Maryland 1,833 10.5 1.24 .42
Georgia 1,613 9.2 3.21 .71
South Carolina 1,609 9.2 1.76 .23
West Virginia 380 2.2 .89 .17
Kentucky 362 2.1 .67 .33
Tennessee 257 1.5 1.16 .21
Washington, D.C. 195 1.1 1.13 .02
Other 784 4.5 2.26 .60
Total $17,471 100.0% 2.22 .57
24