BB&T 2008 Annual Report Download - page 141
Download and view the complete annual report
Please find page 141 of the 2008 BB&T annual report below. You can navigate through the pages in the report by either clicking on the pages listed below, or by using the keyword search tool below to find specific information within the annual report.-
 1
1 -
2
-
3
-
4
-
5
-
6
-
7
-
8
-
9
-
10
-
11
-
12
-
13
-
14
-
15
-
16
-
17
-
18
-
19
-
20
-
21
-
22
-
23
-
24
-
25
-
26
-
27
-
28
-
29
-
30
-
31
-
32
-
33
-
34
-
35
-
36
-
37
-
38
-
39
-
40
-
41
-
42
-
43
-
44
-
45
-
46
-
47
-
48
-
49
-
50
-
51
-
52
-
53
-
54
-
55
-
56
-
57
-
58
-
59
-
60
-
61
-
62
-
63
-
64
-
65
-
66
-
67
-
68
-
69
-
70
-
71
-
72
-
73
-
74
-
75
-
76
-
77
-
78
-
79
-
80
-
81
-
82
-
83
-
84
-
85
-
86
-
87
-
88
-
89
-
90
-
91
-
92
-
93
-
94
-
95
-
96
-
97
-
98
-
99
-
100
-
101
-
102
-
103
-
104
-
105
-
106
-
107
-
108
-
109
-
110
-
111
-
112
-
113
-
114
-
115
-
116
-
117
-
118
-
119
-
120
-
121
-
122
-
123
-
124
-
125
-
126
-
127
-
128
-
129
-
130
-
 131
131 -
 132
132 -
 133
133 -
 134
134 -
 135
135 -
 136
136 -
 137
137 -
 138
138 -
 139
139 -
 140
140 -
 141
141 -
 142
142 -
 143
143 -
 144
144 -
 145
145 -
 146
146 -
 147
147 -
 148
148 -
 149
149 -
 150
150 -
 151
151 -
152
 |
 |

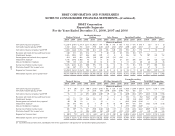
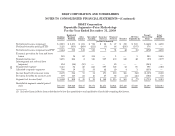
BB&T CORPORATION AND SUBSIDIARIES
NOTES TO CONSOLIDATED FINANCIAL STATEMENTS—(Continued)
BB&T Corporation
Reportable Segments—Prior Methodology
For the Year Ended December 31, 2008
Banking
Network
Residential
Mortgage
Banking Sales
Finance Specialized
Lending Insurance
Services Financial
Services Treasury All Other
Segments (1)
Parent/
Reconciling
Items
Total
BB&T
Corporation
(Dollars in millions)
Net interest income (expense) $ 2,119 $ 1,135 $ 401 $ 711 $ 12 $ 47 $ 300 $ 161 $ (648) $ 4,238
Net funds transfer pricing (FTP) 1,325 (835) (269) (211) (5) 44 (258) (167) 376 —
Net interest income (expense) and FTP 3,444 300 132 500 7 91 42 (6) (272) 4,238
Economic provision for loan and lease
losses 189 10 23 301 — 1 — 1 920 1,445
Noninterest income 1,235 224 2 116 907 630 140 42 (99) 3,197
Intersegment net referral fees
(expense) 254 (96) (13) — — 20 — — (165) —
Noninterest expense 1,545 84 28 243 697 528 12 86 698 3,921
Allocated corporate expenses 700 10 11 38 42 29 4 1 (835) —
Income (loss) before income taxes 2,499 324 59 34 175 183 166 (52) (1,319) 2,069
Provision (benefit) for income taxes 897 116 21 13 67 68 (3) (45) (584) 550
Segment net income (loss) $ 1,602 $ 208 $ 38 $ 21 $ 108 $ 115 $ 169 $ (7) $ (735) $ 1,519
Identifiable segment assets (period
end) $65,358 $19,028 $6,117 $6,571 $1,253 $2,921 $37,438 $5,029 $8,300 $152,015
(1) Includes financial data from subsidiaries below the quantitative and qualitative thresholds requiring disclosure.
141