Coca Cola 2015 Annual Report Download - page 101
Download and view the complete annual report
Please find page 101 of the 2015 Coca Cola annual report below. You can navigate through the pages in the report by either clicking on the pages listed below, or by using the keyword search tool below to find specific information within the annual report.-
 1
1 -
2
-
3
-
4
-
5
-
6
-
7
-
8
-
9
-
10
-
11
-
12
-
13
-
14
-
15
-
16
-
17
-
18
-
19
-
20
-
21
-
22
-
23
-
24
-
25
-
26
-
27
-
28
-
29
-
30
-
31
-
32
-
33
-
34
-
35
-
36
-
37
-
38
-
39
-
40
-
41
-
42
-
43
-
44
-
45
-
46
-
47
-
48
-
49
-
50
-
51
-
52
-
53
-
54
-
55
-
56
-
57
-
58
-
59
-
60
-
61
-
62
-
63
-
64
-
65
-
66
-
67
-
68
-
69
-
70
-
71
-
72
-
73
-
74
-
75
-
76
-
77
-
78
-
79
-
80
-
81
-
82
-
83
-
84
-
85
-
86
-
87
-
88
-
89
-
90
-
 91
91 -
 92
92 -
 93
93 -
 94
94 -
 95
95 -
 96
96 -
 97
97 -
 98
98 -
 99
99 -
 100
100 -
 101
101 -
 102
102 -
 103
103 -
 104
104 -
 105
105 -
 106
106 -
 107
107 -
 108
108 -
 109
109 -
 110
110 -
 111
111 -
112
-
113
-
114
-
115
-
116
-
117
-
118
-
119
-
120
-
121
-
122
-
123
-
124
-
125
-
126
-
127
-
128
-
129
-
130
-
131
-
132
-
133
-
134
-
135
-
136
-
137
-
138
-
139
-
140
-
141
-
142
-
143
-
144
-
145
-
146
-
147
-
148
-
149
-
150
-
151
-
152
-
153
-
154
-
155
-
156
-
157
-
158
-
159
-
160
-
161
-
162
-
163
-
164
-
165
-
166
-
167
-
168
-
169
-
170
-
171
-
172
-
173
-
174
-
175
-
176
-
177
-
178
-
179
-
180
-
181
-
182
-
183
-
184
-
185
-
186
-
187
-
188
-
189
-
190
-
191
-
192
-
193
-
194
-
195
-
196
-
197
-
198
-
199
-
200
-
201
-
202
-
203
-
204
-
205
-
206
-
207
-
208
-
209
-
210
-
211
-
212
-
213
-
214
-
215
-
216
-
217
-
218
-
219
-
220
 |
 |

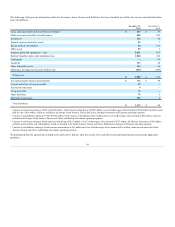
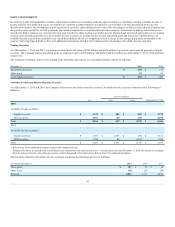
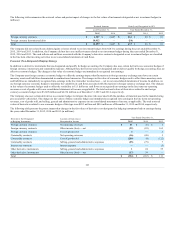
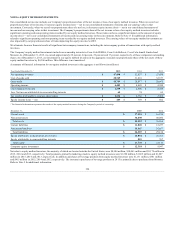
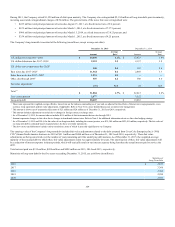
The following table presents the fair values of the Company's derivative instruments that were not designated as hedging instruments (in millions):
Fair Value1,2
Derivatives Not Designated as Hedging Instruments Balance Sheet Location1
December 31,
2014
Assets:
Foreign currency contracts Prepaid expenses and other assets
$ 44
Foreign currency contracts Other assets
231
Commodity contracts Prepaid expenses and other assets
9
Commodity contracts Other assets
1
Other derivative instruments Prepaid expenses and other assets
14
Other derivative instruments Other assets
2
Total assets
$ 301
Liabilities:
Foreign currency contracts Accounts payable and accrued expenses
$ 33
Foreign currency contracts Other liabilities
21
Commodity contracts Accounts payable and accrued expenses
156
Commodity contracts Other liabilities
17
Interest rate contracts Other liabilities
2
Other derivative instruments Accounts payable and accrued expenses
11
Other derivative instruments Other liabilities
—
Total liabilities
$ 240
1 All of the Company's derivative instruments are carried at fair value in our consolidated balance sheets after considering the impact of legally enforceable master netting
agreements and cash collateral held or placed with the same counterparties, as applicable. Current disclosure requirements mandate that derivatives must also be disclosed without
reflecting the impact of master netting agreements and cash collateral. Refer to Note 16 for the net presentation of the Company's derivative instruments.
2 Refer to Note 16 for additional information related to the estimated fair value.
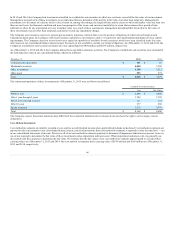
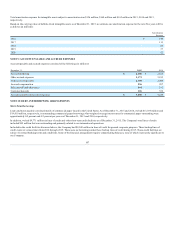
Credit Risk Associated with Derivatives
We have established strict counterparty credit guidelines and enter into transactions only with financial institutions of investment grade or better. We
monitor counterparty exposures regularly and review any downgrade in credit rating immediately. If a downgrade in the credit rating of a counterparty were
to occur, we have provisions requiring collateral for substantially all of our transactions. To mitigate presettlement risk, minimum credit standards become
more stringent as the duration of the derivative financial instrument increases. In addition, the Company's master netting agreements reduce credit risk by
permitting the Company to net settle for transactions with the same counterparty. To minimize the concentration of credit risk, we enter into derivative
transactions with a portfolio of financial institutions. Based on these factors, we consider the risk of counterparty default to be minimal.
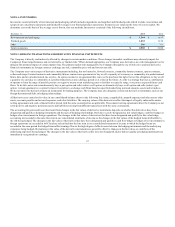
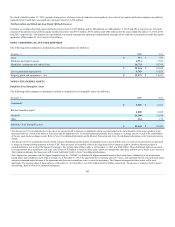
Cash Flow Hedging Strategy
The Company uses cash flow hedges to minimize the variability in cash flows of assets or liabilities or forecasted transactions caused by fluctuations in
foreign currency exchange rates, commodity prices or interest rates. The changes in the fair values of derivatives designated as cash flow hedges are recorded
in AOCI and are reclassified into the line item in our consolidated statement of income in which the hedged items are recorded in the same period the hedged
items affect earnings. The changes in fair values of hedges that are determined to be ineffective are immediately reclassified from AOCI into earnings. The
maximum length of time for which the Company hedges its exposure to the variability in future cash flows is typically three years.
99