Coca Cola 2015 Annual Report Download - page 49
Download and view the complete annual report
Please find page 49 of the 2015 Coca Cola annual report below. You can navigate through the pages in the report by either clicking on the pages listed below, or by using the keyword search tool below to find specific information within the annual report.-
 1
1 -
2
-
3
-
4
-
5
-
6
-
7
-
8
-
9
-
10
-
11
-
12
-
13
-
14
-
15
-
16
-
17
-
18
-
19
-
20
-
21
-
22
-
23
-
24
-
25
-
26
-
27
-
28
-
29
-
30
-
31
-
32
-
33
-
34
-
35
-
36
-
37
-
38
-
 39
39 -
 40
40 -
 41
41 -
 42
42 -
 43
43 -
 44
44 -
 45
45 -
 46
46 -
 47
47 -
 48
48 -
 49
49 -
 50
50 -
 51
51 -
 52
52 -
 53
53 -
 54
54 -
 55
55 -
 56
56 -
 57
57 -
 58
58 -
 59
59 -
60
-
61
-
62
-
63
-
64
-
65
-
66
-
67
-
68
-
69
-
70
-
71
-
72
-
73
-
74
-
75
-
76
-
77
-
78
-
79
-
80
-
81
-
82
-
83
-
84
-
85
-
86
-
87
-
88
-
89
-
90
-
91
-
92
-
93
-
94
-
95
-
96
-
97
-
98
-
99
-
100
-
101
-
102
-
103
-
104
-
105
-
106
-
107
-
108
-
109
-
110
-
111
-
112
-
113
-
114
-
115
-
116
-
117
-
118
-
119
-
120
-
121
-
122
-
123
-
124
-
125
-
126
-
127
-
128
-
129
-
130
-
131
-
132
-
133
-
134
-
135
-
136
-
137
-
138
-
139
-
140
-
141
-
142
-
143
-
144
-
145
-
146
-
147
-
148
-
149
-
150
-
151
-
152
-
153
-
154
-
155
-
156
-
157
-
158
-
159
-
160
-
161
-
162
-
163
-
164
-
165
-
166
-
167
-
168
-
169
-
170
-
171
-
172
-
173
-
174
-
175
-
176
-
177
-
178
-
179
-
180
-
181
-
182
-
183
-
184
-
185
-
186
-
187
-
188
-
189
-
190
-
191
-
192
-
193
-
194
-
195
-
196
-
197
-
198
-
199
-
200
-
201
-
202
-
203
-
204
-
205
-
206
-
207
-
208
-
209
-
210
-
211
-
212
-
213
-
214
-
215
-
216
-
217
-
218
-
219
-
220
 |
 |
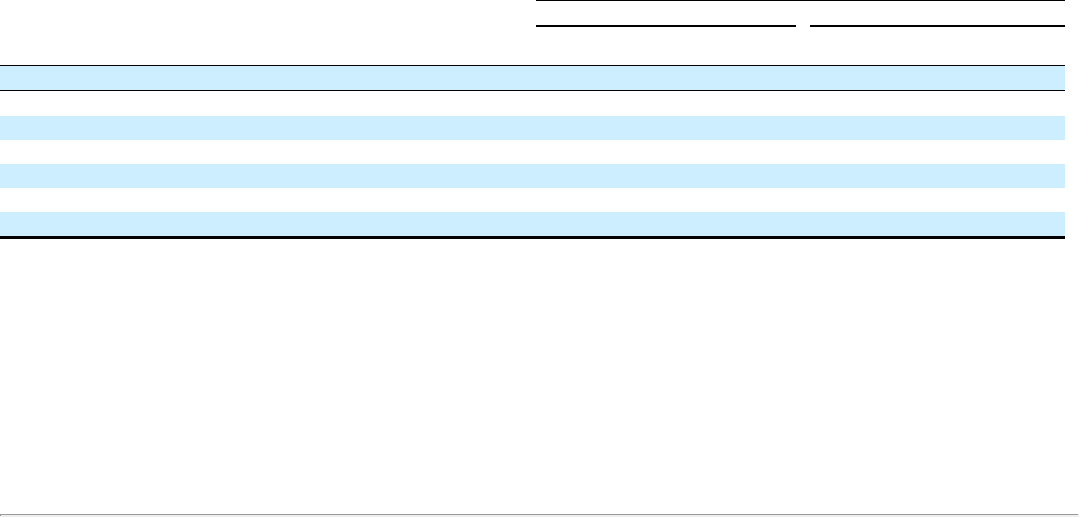
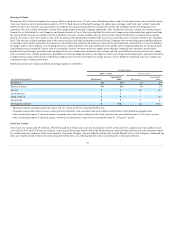
Beverage Volume
We measure the volume of Company beverage products sold in two ways: (1) unit cases of finished products and (2) concentrate sales. As used in this report,
"unit case" means a unit of measurement equal to 192 U.S. fluid ounces of finished beverage (24 eight-ounce servings); and "unit case volume" means the
number of unit cases (or unit case equivalents) of Company beverage products directly or indirectly sold by the Company and its bottling partners to
customers. Unit case volume primarily consists of beverage products bearing Company trademarks. Also included in unit case volume are certain products
licensed to, or distributed by, our Company, and brands owned by Coca-Cola system bottlers for which our Company provides marketing support and from
the sale of which we derive economic benefit. In addition, unit case volume includes sales by certain joint ventures in which the Company has an equity
interest. We believe unit case volume is one of the measures of the underlying strength of the Coca-Cola system because it measures trends at the consumer
level. The unit case volume numbers used in this report are derived based on estimates received by the Company from its bottling partners and distributors.
Concentrate sales volume represents the amount of concentrates and syrups (in all instances expressed in equivalent unit cases) sold by, or used in finished
beverages sold by, the Company to its bottling partners or other customers. Unit case volume and concentrate sales volume growth rates are not necessarily
equal during any given period. Factors such as seasonality, bottlers' inventory practices, supply point changes, timing of price increases, new product
introductions and changes in product mix can impact unit case volume and concentrate sales volume and can create differences between unit case volume
and concentrate sales volume growth rates. In addition to the items mentioned above, the impact of unit case volume from certain joint ventures in which the
Company has an equity interest but to which the Company does not sell concentrates or syrups may give rise to differences between unit case volume and
concentrate sales volume growth rates.
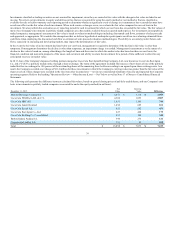
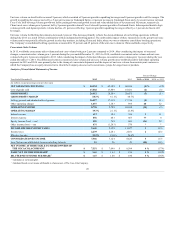
Information about our volume growth by operating segment is as follows:
Percent Change
2014 vs. 2013
Year Ended December 31,
Unit Cases1,2
Concentrate
Sales
Worldwide
2%
2% 4
Eurasia & Africa
4%
3%
Europe
(2)
(2)
Latin America
1
—
North America
—
(1)
Asia Pacific
5
5
Bottling Investments
(2)
N/A
1 Bottling Investments operating segment data reflects unit case volume growth for consolidated bottlers only.
2 Geographic segment data reflects unit case volume growth for all bottlers, both consolidated and unconsolidated, and distributors in the applicable geographic areas.
3 After considering the impact of structural changes, concentrate sales volume both worldwide and for North America for the year ended December 31, 2015 grew 1 percent.
4 After considering the impact of structural changes, worldwide concentrate sales volume for the year ended December 31, 2014 grew 1 percent.
Unit Case Volume
The Coca-Cola system sold 29.2 billion, 28.6 billion and 28.2 billion unit cases of our products in 2015, 2014 and 2013, respectively. The number of unit
cases sold in 2015 and 2014 does not include certain licensed beverage brands sold in the North American refranchised territories and certain brands owned
by our Russian juice company. Refer to the heading "Structural Changes, Acquired Brands and Newly Licensed Brands" above. The Company eliminated the
unit case volume related to these structural changes from the base year, where applicable, when calculating the volume growth rates.
47