Coca Cola 2015 Annual Report Download - page 130
Download and view the complete annual report
Please find page 130 of the 2015 Coca Cola annual report below. You can navigate through the pages in the report by either clicking on the pages listed below, or by using the keyword search tool below to find specific information within the annual report.-
 1
1 -
2
-
3
-
4
-
5
-
6
-
7
-
8
-
9
-
10
-
11
-
12
-
13
-
14
-
15
-
16
-
17
-
18
-
19
-
20
-
21
-
22
-
23
-
24
-
25
-
26
-
27
-
28
-
29
-
30
-
31
-
32
-
33
-
34
-
35
-
36
-
37
-
38
-
39
-
40
-
41
-
42
-
43
-
44
-
45
-
46
-
47
-
48
-
49
-
50
-
51
-
52
-
53
-
54
-
55
-
56
-
57
-
58
-
59
-
60
-
61
-
62
-
63
-
64
-
65
-
66
-
67
-
68
-
69
-
70
-
71
-
72
-
73
-
74
-
75
-
76
-
77
-
78
-
79
-
80
-
81
-
82
-
83
-
84
-
85
-
86
-
87
-
88
-
89
-
90
-
91
-
92
-
93
-
94
-
95
-
96
-
97
-
98
-
99
-
100
-
101
-
102
-
103
-
104
-
105
-
106
-
107
-
108
-
109
-
110
-
111
-
112
-
113
-
114
-
115
-
116
-
117
-
118
-
119
-
 120
120 -
 121
121 -
 122
122 -
 123
123 -
 124
124 -
 125
125 -
 126
126 -
 127
127 -
 128
128 -
 129
129 -
 130
130 -
 131
131 -
 132
132 -
 133
133 -
 134
134 -
 135
135 -
 136
136 -
 137
137 -
 138
138 -
 139
139 -
 140
140 -
141
-
142
-
143
-
144
-
145
-
146
-
147
-
148
-
149
-
150
-
151
-
152
-
153
-
154
-
155
-
156
-
157
-
158
-
159
-
160
-
161
-
162
-
163
-
164
-
165
-
166
-
167
-
168
-
169
-
170
-
171
-
172
-
173
-
174
-
175
-
176
-
177
-
178
-
179
-
180
-
181
-
182
-
183
-
184
-
185
-
186
-
187
-
188
-
189
-
190
-
191
-
192
-
193
-
194
-
195
-
196
-
197
-
198
-
199
-
200
-
201
-
202
-
203
-
204
-
205
-
206
-
207
-
208
-
209
-
210
-
211
-
212
-
213
-
214
-
215
-
216
-
217
-
218
-
219
-
220
 |
 |

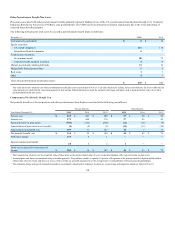
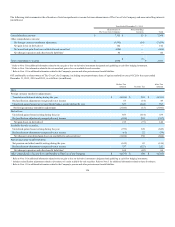
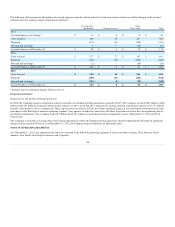
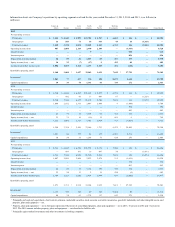
The following table presents the amounts and line items in our consolidated statements of income where adjustments reclassified from AOCI into income
were recorded during the year ended December 31, 2015 (in millions):
Description of AOCI Component Financial Statement Line Item
Amount Reclassified from
AOCI into Income
Foreign currency translation adjustments:
Divestitures, deconsolidations and other Other income (loss) — net $ 63
Income before income taxes $ 63
Income taxes (14)
Consolidated net income $ 49
Derivatives:
Foreign currency contracts Net operating revenues $ (630)
Foreign currency and commodity contracts Cost of goods sold (59)
Foreign currency contracts Other income (loss) — net 40
Foreign currency and interest rate contracts Interest expense 11
Income before income taxes $ (638)
Income taxes 241
Consolidated net income $ (397)
Available-for-sale securities:
Sale of securities Other income (loss) — net $ (61)
Income before income taxes $ (61)
Income taxes 22
Consolidated net income $ (39)
Pension and other benefit liabilities:
Recognized net actuarial loss (gain) * $ 358
Recognized prior service cost (credit) * (21)
Income before income taxes $ 337
Income taxes (125)
Consolidated net income $ 212
*This component of AOCI is included in the Company's computation of net periodic benefit cost and is not reclassified out of AOCI into a single line item in our consolidated
statements of income in its entirety. Refer to Note 13 for additional information.
Accounting principles generally accepted in the United States define fair value as the exchange price that would be received for an asset or paid to transfer a
liability (an exit price) in the principal or most advantageous market for the asset or liability in an orderly transaction between market participants at the
measurement date. Additionally, the inputs used to measure fair value are prioritized based on a three-level hierarchy. This hierarchy requires entities to
maximize the use of observable inputs and minimize the use of unobservable inputs. The three levels of inputs used to measure fair value are as follows:
• Level 1 — Quoted prices in active markets for identical assets or liabilities.
• Level 2 — Observable inputs other than quoted prices included in Level 1. We value assets and liabilities included in this level using dealer and
broker quotations, certain pricing models, bid prices, quoted prices for similar assets and liabilities in active markets, or other inputs that are
observable or can be corroborated by observable market data.
• Level 3 — Unobservable inputs that are supported by little or no market activity and that are significant to the fair value of the assets or liabilities.
This includes certain pricing models, discounted cash flow methodologies and similar techniques that use significant unobservable inputs.
128