Coca Cola 2015 Annual Report Download - page 97
Download and view the complete annual report
Please find page 97 of the 2015 Coca Cola annual report below. You can navigate through the pages in the report by either clicking on the pages listed below, or by using the keyword search tool below to find specific information within the annual report.-
 1
1 -
2
-
3
-
4
-
5
-
6
-
7
-
8
-
9
-
10
-
11
-
12
-
13
-
14
-
15
-
16
-
17
-
18
-
19
-
20
-
21
-
22
-
23
-
24
-
25
-
26
-
27
-
28
-
29
-
30
-
31
-
32
-
33
-
34
-
35
-
36
-
37
-
38
-
39
-
40
-
41
-
42
-
43
-
44
-
45
-
46
-
47
-
48
-
49
-
50
-
51
-
52
-
53
-
54
-
55
-
56
-
57
-
58
-
59
-
60
-
61
-
62
-
63
-
64
-
65
-
66
-
67
-
68
-
69
-
70
-
71
-
72
-
73
-
74
-
75
-
76
-
77
-
78
-
79
-
80
-
81
-
82
-
83
-
84
-
85
-
86
-
 87
87 -
 88
88 -
 89
89 -
 90
90 -
 91
91 -
 92
92 -
 93
93 -
 94
94 -
 95
95 -
 96
96 -
 97
97 -
 98
98 -
 99
99 -
 100
100 -
 101
101 -
 102
102 -
 103
103 -
 104
104 -
 105
105 -
 106
106 -
 107
107 -
108
-
109
-
110
-
111
-
112
-
113
-
114
-
115
-
116
-
117
-
118
-
119
-
120
-
121
-
122
-
123
-
124
-
125
-
126
-
127
-
128
-
129
-
130
-
131
-
132
-
133
-
134
-
135
-
136
-
137
-
138
-
139
-
140
-
141
-
142
-
143
-
144
-
145
-
146
-
147
-
148
-
149
-
150
-
151
-
152
-
153
-
154
-
155
-
156
-
157
-
158
-
159
-
160
-
161
-
162
-
163
-
164
-
165
-
166
-
167
-
168
-
169
-
170
-
171
-
172
-
173
-
174
-
175
-
176
-
177
-
178
-
179
-
180
-
181
-
182
-
183
-
184
-
185
-
186
-
187
-
188
-
189
-
190
-
191
-
192
-
193
-
194
-
195
-
196
-
197
-
198
-
199
-
200
-
201
-
202
-
203
-
204
-
205
-
206
-
207
-
208
-
209
-
210
-
211
-
212
-
213
-
214
-
215
-
216
-
217
-
218
-
219
-
220
 |
 |
Investments in debt and marketable securities, other than investments accounted for under the equity method, are classified as trading, available-for-sale or
held-to-maturity. Our marketable equity investments are classified as either trading or available-for-sale with their cost basis determined by the specific
identification method. Our investments in debt securities are carried at either amortized cost or fair value. Investments in debt securities that the Company has
the positive intent and ability to hold to maturity are carried at amortized cost and classified as held-to-maturity. Investments in debt securities that are not
classified as held-to-maturity are carried at fair value and classified as either trading or available-for-sale. Realized and unrealized gains and losses on trading
securities and realized gains and losses on available-for-sale securities are included in net income. Unrealized gains and losses, net of deferred taxes, on
available-for-sale securities are included in our consolidated balance sheets as a component of AOCI, except for the change in fair value attributable to the
currency risk being hedged. Refer to Note 5 for additional information related to the Company's fair value hedges of available-for-sale securities.
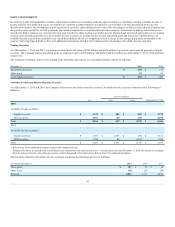
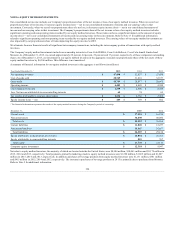
Trading Securities
As of December 31, 2015 and 2014, our trading securities had a fair value of $322 million and $409 million, respectively, and consisted primarily of equity
securities. The Company had net unrealized gains on trading securities of $19 million, $40 million and $12 million as of December 31, 2015, 2014 and 2013,
respectively.
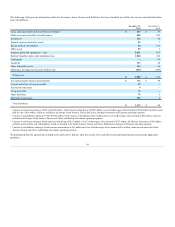
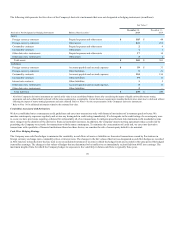
The Company's trading securities were included in the following line items in our consolidated balance sheets (in millions):
December 31,
2014
Marketable securities
$ 315
Other assets
94
Total trading securities
$ 409
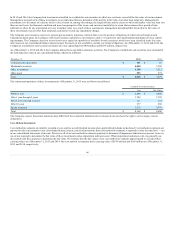
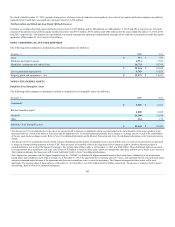
Available-for-Sale and Held-to-Maturity Securities
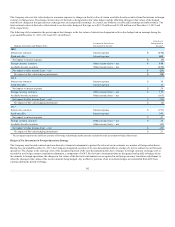
As of December 31, 2015 and 2014, the Company did not have any held-to-maturity securities. Available-for-sale securities consisted of the following (in
millions):
Gross Unrealized
Estimated Fair Value
Cost
Gains
Losses
Available-for-sale securities:1
Equity securities
Debt securities
Total
2014
Available-for-sale securities:1
Equity securities $ 2,687
$ 1,463
$ (29)
$ 4,121
Debt securities 3,796
68
(106) 2 3,758
Total $ 6,483
$ 1,531
$ (135)
$ 7,879
1 Refer to Note 16 for additional information related to the estimated fair value.
2 Includes $101 million recognized in the consolidated income statement line item other income (loss) — net during the year ended December 31, 2014. The amount was primarily
offset by changes in the fair value of foreign currency contracts designated as fair value hedges. Refer to Note 5 for additional information.
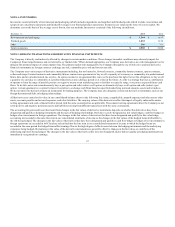
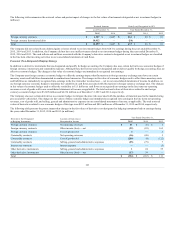
The sale and/or maturity of available-for-sale securities resulted in the following activity (in millions):
Year Ended December 31,
2014
2013
Gross gains
$ 38
$ 12
Gross losses
(21)
(24)
Proceeds
4,157
4,212
95