Coca Cola 2015 Annual Report Download - page 84
Download and view the complete annual report
Please find page 84 of the 2015 Coca Cola annual report below. You can navigate through the pages in the report by either clicking on the pages listed below, or by using the keyword search tool below to find specific information within the annual report.-
 1
1 -
2
-
3
-
4
-
5
-
6
-
7
-
8
-
9
-
10
-
11
-
12
-
13
-
14
-
15
-
16
-
17
-
18
-
19
-
20
-
21
-
22
-
23
-
24
-
25
-
26
-
27
-
28
-
29
-
30
-
31
-
32
-
33
-
34
-
35
-
36
-
37
-
38
-
39
-
40
-
41
-
42
-
43
-
44
-
45
-
46
-
47
-
48
-
49
-
50
-
51
-
52
-
53
-
54
-
55
-
56
-
57
-
58
-
59
-
60
-
61
-
62
-
63
-
64
-
65
-
66
-
67
-
68
-
69
-
70
-
71
-
72
-
73
-
 74
74 -
 75
75 -
 76
76 -
 77
77 -
 78
78 -
 79
79 -
 80
80 -
 81
81 -
 82
82 -
 83
83 -
 84
84 -
 85
85 -
 86
86 -
 87
87 -
 88
88 -
 89
89 -
 90
90 -
 91
91 -
 92
92 -
 93
93 -
 94
94 -
95
-
96
-
97
-
98
-
99
-
100
-
101
-
102
-
103
-
104
-
105
-
106
-
107
-
108
-
109
-
110
-
111
-
112
-
113
-
114
-
115
-
116
-
117
-
118
-
119
-
120
-
121
-
122
-
123
-
124
-
125
-
126
-
127
-
128
-
129
-
130
-
131
-
132
-
133
-
134
-
135
-
136
-
137
-
138
-
139
-
140
-
141
-
142
-
143
-
144
-
145
-
146
-
147
-
148
-
149
-
150
-
151
-
152
-
153
-
154
-
155
-
156
-
157
-
158
-
159
-
160
-
161
-
162
-
163
-
164
-
165
-
166
-
167
-
168
-
169
-
170
-
171
-
172
-
173
-
174
-
175
-
176
-
177
-
178
-
179
-
180
-
181
-
182
-
183
-
184
-
185
-
186
-
187
-
188
-
189
-
190
-
191
-
192
-
193
-
194
-
195
-
196
-
197
-
198
-
199
-
200
-
201
-
202
-
203
-
204
-
205
-
206
-
207
-
208
-
209
-
210
-
211
-
212
-
213
-
214
-
215
-
216
-
217
-
218
-
219
-
220
 |
 |

value; and actions required to complete the plan indicate that it is unlikely that significant changes to the plan will be made or that the plan will be
withdrawn.
We initially measure a long-lived asset or disposal group that is classified as held for sale at the lower of its carrying value or fair value less any costs to sell.
Any loss resulting from this measurement is recognized in the period in which the held-for-sale criteria are met. Conversely, gains are not recognized on the
sale of a long-lived asset or disposal group until the date of sale. We assess the fair value of a long-lived asset or disposal group less any costs to sell each
reporting period it remains classified as held for sale and report any subsequent changes as an adjustment to the carrying value of the asset or disposal group,
as long as the new carrying value does not exceed the carrying value of the asset at the time it was initially classified as held for sale.
Upon determining that a long-lived asset or disposal group meets the criteria to be classified as held for sale, the Company ceases depreciation and reports
long-lived assets and/or the assets and liabilities of the disposal group, if material, in the line items assets held for sale and liabilities held for sale,
respectively, in our consolidated balance sheet. Refer to Note 2.
Revenue Recognition
Our Company recognizes revenue when persuasive evidence of an arrangement exists, delivery of products has occurred, the sales price charged is fixed or
determinable, and collectibility is reasonably assured. For our Company, this generally means that we recognize revenue when title to our products is
transferred to our bottling partners, resellers or other customers. In particular, title usually transfers upon shipment to or receipt at our customers' locations, as
determined by the specific sales terms of the transactions. Our sales terms do not allow for a right of return except for matters related to any manufacturing
defects on our part.
Deductions from Revenue
Our customers can earn certain incentives including, but not limited to, cash discounts, funds for promotional and marketing activities, volume-based
incentive programs and support for infrastructure programs. The costs associated with these incentives are included in deductions from revenue, a component
of net operating revenues in our consolidated statements of income. For customer incentives that must be earned, management must make estimates related to
the contractual terms, customer performance and sales volume to determine the total amounts earned and to be recorded in deductions from revenue. In
making these estimates, management considers past results. The actual amounts ultimately paid may be different from our estimates.
In some situations, the Company may determine it to be advantageous to make advance payments to specific customers to fund certain marketing activities
intended to generate profitable volume and/or invest in infrastructure programs with our bottlers that are directed at strengthening our bottling system and
increasing unit case volume. The Company also makes advance payments to certain customers for distribution rights. The advance payments made to
customers are initially capitalized and included in our consolidated balance sheets in prepaid expenses and other assets and noncurrent other assets,
depending on the duration of the agreements. The assets are amortized over the applicable periods and included in deductions from revenue. The duration of
these agreements typically range up to 10 years.
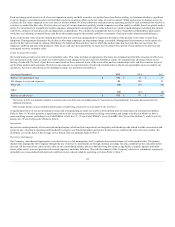
Amortization expense for infrastructure programs was $61 million, $72 million and $69 million in 2015, 2014 and 2013, respectively. The aggregate
deductions from revenue recorded by the Company in relation to these programs, including amortization expense on infrastructure programs, were $6.8
billion, $7.0 billion and $6.9 billion in 2015, 2014 and 2013, respectively.
Advertising Costs
Our Company expenses production costs of print, radio, television and other advertisements as of the first date the advertisements take place. All other
marketing expenditures are expensed in the annual period in which the expenditure is incurred. Advertising costs included in the line item selling, general
and administrative expenses in our consolidated statements of income were $4.0 billion, $3.5 billion and $3.3 billion in 2015, 2014 and 2013, respectively.
As of December 31, 2015 and 2014, advertising and production costs of $207 million and $228 million, respectively, were primarily recorded in the line item
prepaid expenses and other assets in our consolidated balance sheets.
For interim reporting purposes, we allocate our estimated full year marketing expenditures that benefit multiple interim periods to each of our interim
reporting periods. We use the proportion of each interim period's actual unit case volume to the estimated full year unit case volume as the basis for the
allocation. This methodology results in our marketing expenditures being recognized at a standard rate per unit case. At the end of each interim reporting
period, we review our estimated full year unit case volume and our estimated full year marketing expenditures in order to evaluate if a change in estimate is
necessary. The impact of any changes in these full year estimates is recognized in the interim period in which the change in estimate occurs. Our full year
marketing expenditures are not impacted by this interim accounting policy.
82