Coca Cola 2015 Annual Report Download - page 116
Download and view the complete annual report
Please find page 116 of the 2015 Coca Cola annual report below. You can navigate through the pages in the report by either clicking on the pages listed below, or by using the keyword search tool below to find specific information within the annual report.-
 1
1 -
2
-
3
-
4
-
5
-
6
-
7
-
8
-
9
-
10
-
11
-
12
-
13
-
14
-
15
-
16
-
17
-
18
-
19
-
20
-
21
-
22
-
23
-
24
-
25
-
26
-
27
-
28
-
29
-
30
-
31
-
32
-
33
-
34
-
35
-
36
-
37
-
38
-
39
-
40
-
41
-
42
-
43
-
44
-
45
-
46
-
47
-
48
-
49
-
50
-
51
-
52
-
53
-
54
-
55
-
56
-
57
-
58
-
59
-
60
-
61
-
62
-
63
-
64
-
65
-
66
-
67
-
68
-
69
-
70
-
71
-
72
-
73
-
74
-
75
-
76
-
77
-
78
-
79
-
80
-
81
-
82
-
83
-
84
-
85
-
86
-
87
-
88
-
89
-
90
-
91
-
92
-
93
-
94
-
95
-
96
-
97
-
98
-
99
-
100
-
101
-
102
-
103
-
104
-
105
-
 106
106 -
 107
107 -
 108
108 -
 109
109 -
 110
110 -
 111
111 -
 112
112 -
 113
113 -
 114
114 -
 115
115 -
 116
116 -
 117
117 -
 118
118 -
 119
119 -
 120
120 -
 121
121 -
 122
122 -
 123
123 -
 124
124 -
 125
125 -
 126
126 -
127
-
128
-
129
-
130
-
131
-
132
-
133
-
134
-
135
-
136
-
137
-
138
-
139
-
140
-
141
-
142
-
143
-
144
-
145
-
146
-
147
-
148
-
149
-
150
-
151
-
152
-
153
-
154
-
155
-
156
-
157
-
158
-
159
-
160
-
161
-
162
-
163
-
164
-
165
-
166
-
167
-
168
-
169
-
170
-
171
-
172
-
173
-
174
-
175
-
176
-
177
-
178
-
179
-
180
-
181
-
182
-
183
-
184
-
185
-
186
-
187
-
188
-
189
-
190
-
191
-
192
-
193
-
194
-
195
-
196
-
197
-
198
-
199
-
200
-
201
-
202
-
203
-
204
-
205
-
206
-
207
-
208
-
209
-
210
-
211
-
212
-
213
-
214
-
215
-
216
-
217
-
218
-
219
-
220
 |
 |

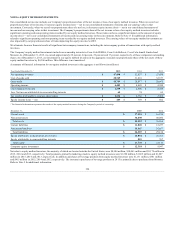
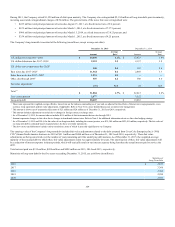
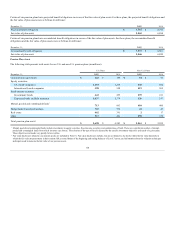
The weighted-average grant date fair value of performance share units granted was $37.99 in 2015, $32.33 in 2014 and $32.67 in 2013. The Company did
not convert any performance share units into cash equivalent payments in 2015. The Company converted performance share units of 5,403 in 2014 and
54,999 in 2013 to cash equivalent payments of $0.2 million and $1.8 million, respectively, to former employees or their beneficiaries due to certain events
such as death or disability.
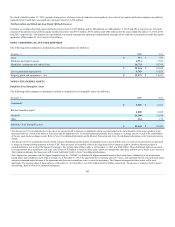
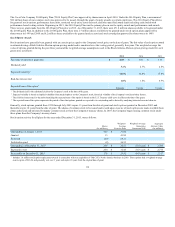
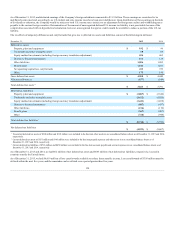
The following table summarizes information about performance share units that were previously converted to restricted stock or restricted stock units:
Restricted Stock and
Restricted Stock
Units
(In thousands)
Weighted-Average
Grant Date
Fair Value1
Nonvested on January 1, 20152130
$ 25.17
Vested and released (130)
25.17
Nonvested on December 31, 2015 —
$ —
1 The weighted-average grant date fair value is based on the fair values of the performance share units granted.
2 The nonvested restricted stock and stock units as of January 1, 2015 are presented at the performance share units' certified award level.
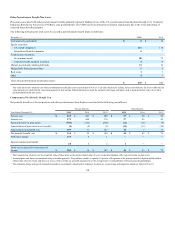
The total intrinsic value of restricted shares that were vested and released was $5 million, $255 million and $16 million in 2015, 2014 and 2013,
respectively. The total restricted share units vested and released in 2015 were 130,017 at the certified award level. In 2014 and 2013, the total restricted share
units vested and released were 6,773,934 and 405,963, respectively.
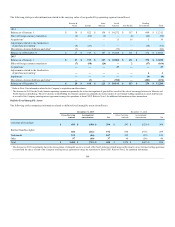
Time-Based Restricted Stock and Restricted Stock Unit Awards
Prior to the release date, time-based restricted stock and restricted stock units granted from the 2014 Equity Plan do not pay dividends or have voting rights
and will be forfeited in the event of the recipient's termination of employment, except for reasons such as death or disability. Certain other time-based
restricted stock awards entitled participants to vote and receive dividends, while for time-based restricted stock units, participants may receive payment of
dividend equivalents but are not allowed to vote. The fair value of the restricted stock and restricted stock units expected to vest and be released is expensed
on a straight-line basis over the vesting period. As of December 31, 2015, the Company had outstanding nonvested time-based restricted stock, including
restricted stock units, of 941,205, most of which do not pay dividends or have voting rights.
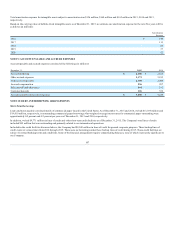
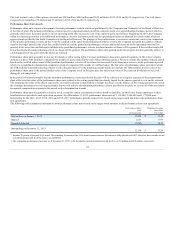
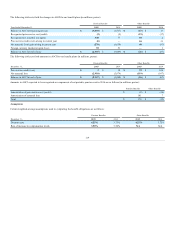
Our Company sponsors and/or contributes to pension and postretirement health care and life insurance benefit plans covering substantially all U.S.
employees. We also sponsor nonqualified, unfunded defined benefit pension plans for certain associates. In addition, our Company and its subsidiaries have
various pension plans and other forms of postretirement arrangements outside the United States.
We refer to the funded defined benefit pension plan in the United States that is not associated with collective bargaining organizations as the "primary U.S.
plan." As of December 31, 2015, the primary U.S. plan represented 59 percent and 62 percent of the Company's consolidated projected benefit obligation and
pension assets, respectively.
114