Coca Cola 2015 Annual Report Download - page 149
Download and view the complete annual report
Please find page 149 of the 2015 Coca Cola annual report below. You can navigate through the pages in the report by either clicking on the pages listed below, or by using the keyword search tool below to find specific information within the annual report.-
 1
1 -
2
-
3
-
4
-
5
-
6
-
7
-
8
-
9
-
10
-
11
-
12
-
13
-
14
-
15
-
16
-
17
-
18
-
19
-
20
-
21
-
22
-
23
-
24
-
25
-
26
-
27
-
28
-
29
-
30
-
31
-
32
-
33
-
34
-
35
-
36
-
37
-
38
-
39
-
40
-
41
-
42
-
43
-
44
-
45
-
46
-
47
-
48
-
49
-
50
-
51
-
52
-
53
-
54
-
55
-
56
-
57
-
58
-
59
-
60
-
61
-
62
-
63
-
64
-
65
-
66
-
67
-
68
-
69
-
70
-
71
-
72
-
73
-
74
-
75
-
76
-
77
-
78
-
79
-
80
-
81
-
82
-
83
-
84
-
85
-
86
-
87
-
88
-
89
-
90
-
91
-
92
-
93
-
94
-
95
-
96
-
97
-
98
-
99
-
100
-
101
-
102
-
103
-
104
-
105
-
106
-
107
-
108
-
109
-
110
-
111
-
112
-
113
-
114
-
115
-
116
-
117
-
118
-
119
-
120
-
121
-
122
-
123
-
124
-
125
-
126
-
127
-
128
-
129
-
130
-
131
-
132
-
133
-
134
-
135
-
136
-
137
-
138
-
 139
139 -
 140
140 -
 141
141 -
 142
142 -
 143
143 -
 144
144 -
 145
145 -
 146
146 -
 147
147 -
 148
148 -
 149
149 -
 150
150 -
 151
151 -
 152
152 -
 153
153 -
 154
154 -
 155
155 -
 156
156 -
 157
157 -
 158
158 -
 159
159 -
160
-
161
-
162
-
163
-
164
-
165
-
166
-
167
-
168
-
169
-
170
-
171
-
172
-
173
-
174
-
175
-
176
-
177
-
178
-
179
-
180
-
181
-
182
-
183
-
184
-
185
-
186
-
187
-
188
-
189
-
190
-
191
-
192
-
193
-
194
-
195
-
196
-
197
-
198
-
199
-
200
-
201
-
202
-
203
-
204
-
205
-
206
-
207
-
208
-
209
-
210
-
211
-
212
-
213
-
214
-
215
-
216
-
217
-
218
-
219
-
220
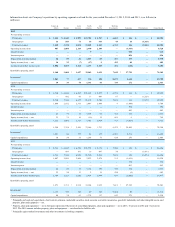
 |
 |

First
Quarter
Second
Quarter
Third
Quarter
Fourth
Quarter
Full Year
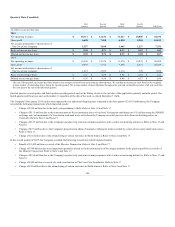
(In millions except per share data)
Net operating revenues
Gross profit
Net income attributable to shareowners of
The Coca-Cola Company
Basic net income per share
Diluted net income per share
2014
Net operating revenues $ 10,576
$ 12,574
$ 11,976
$ 10,872
$ 45,998
Gross profit 6,493
7,755
7,346
6,515
28,109
Net income attributable to shareowners of
The Coca-Cola Company 1,619
2,595
2,114
770
7,098
Basic net income per share $ 0.37
$ 0.59
$ 0.48
$ 0.18
$ 1.62
Diluted net income per share $ 0.36
$ 0.58
$ 0.48
$ 0.17
$ 1.60 1
1 The sum of the quarterly net income per share amounts does not agree to the full year net income per share amounts. We calculate net income per share based on the weighted-
average number of outstanding shares during the reporting period. The average number of shares fluctuates throughout the year and can therefore produce a full year result that
does not agree to the sum of the individual quarters.
Our first quarter, second quarter and third quarter reporting periods end on the Friday closest to the last day of the applicable quarterly calendar period. Our
fourth quarter and fiscal year end on December 31 regardless of the day of the week on which December 31 falls.
The Company's first quarter 2015 results were impacted by six additional shipping days compared to the first quarter of 2014. Furthermore, the Company
recorded the following transactions which impacted results:
• Charge of $320 million due to the early extinguishment of debt. Refer to Note 10 and Note 17.
• Charges of $135 million due to the remeasurement of the net monetary assets of our local Venezuelan subsidiary into U.S. dollars using the SIMADI
exchange rate, an impairment of a Venezuelan trademark and a write-down the Company recorded on receivables from our bottling partner in
Venezuela. Refer to Note 1 and Note 17.
• Charges of $125 million due to the Company's productivity and reinvestment program as well as other restructuring initiatives. Refer to Note 17 and
Note 18.
• Charges of $73 million due to the Company's proportionate share of unusual or infrequent items recorded by certain of our equity method investees.
Refer to Note 17.
• Charge of $21 million due to the refranchising of certain territories in North America. Refer to Note 2 and Note 17.
In the second quarter of 2015, the Company recorded the following transactions which impacted results:
• Benefit of $1,402 million as a result of the Monster Transaction. Refer to Note 2 and Note 17.
• Charge of $380 million due to an impairment primarily related to the discontinuation of the energy products in the glacéau portfolio as a result of
the Monster Transaction. Refer to Note 2 and Note 17.
• Charges of $186 million due to the Company's productivity and reinvestment program as well as other restructuring initiatives. Refer to Note 17 and
Note 18.
• Charge of $100 million as a result of a cash contribution to The Coca-Cola Foundation. Refer to Note 17.
• Charge of $12 million due to the refranchising of certain territories in North America. Refer to Note 2 and Note 17.
146