Coca Cola 2015 Annual Report Download - page 52
Download and view the complete annual report
Please find page 52 of the 2015 Coca Cola annual report below. You can navigate through the pages in the report by either clicking on the pages listed below, or by using the keyword search tool below to find specific information within the annual report.-
 1
1 -
2
-
3
-
4
-
5
-
6
-
7
-
8
-
9
-
10
-
11
-
12
-
13
-
14
-
15
-
16
-
17
-
18
-
19
-
20
-
21
-
22
-
23
-
24
-
25
-
26
-
27
-
28
-
29
-
30
-
31
-
32
-
33
-
34
-
35
-
36
-
37
-
38
-
39
-
40
-
41
-
 42
42 -
 43
43 -
 44
44 -
 45
45 -
 46
46 -
 47
47 -
 48
48 -
 49
49 -
 50
50 -
 51
51 -
 52
52 -
 53
53 -
 54
54 -
 55
55 -
 56
56 -
 57
57 -
 58
58 -
 59
59 -
 60
60 -
 61
61 -
 62
62 -
63
-
64
-
65
-
66
-
67
-
68
-
69
-
70
-
71
-
72
-
73
-
74
-
75
-
76
-
77
-
78
-
79
-
80
-
81
-
82
-
83
-
84
-
85
-
86
-
87
-
88
-
89
-
90
-
91
-
92
-
93
-
94
-
95
-
96
-
97
-
98
-
99
-
100
-
101
-
102
-
103
-
104
-
105
-
106
-
107
-
108
-
109
-
110
-
111
-
112
-
113
-
114
-
115
-
116
-
117
-
118
-
119
-
120
-
121
-
122
-
123
-
124
-
125
-
126
-
127
-
128
-
129
-
130
-
131
-
132
-
133
-
134
-
135
-
136
-
137
-
138
-
139
-
140
-
141
-
142
-
143
-
144
-
145
-
146
-
147
-
148
-
149
-
150
-
151
-
152
-
153
-
154
-
155
-
156
-
157
-
158
-
159
-
160
-
161
-
162
-
163
-
164
-
165
-
166
-
167
-
168
-
169
-
170
-
171
-
172
-
173
-
174
-
175
-
176
-
177
-
178
-
179
-
180
-
181
-
182
-
183
-
184
-
185
-
186
-
187
-
188
-
189
-
190
-
191
-
192
-
193
-
194
-
195
-
196
-
197
-
198
-
199
-
200
-
201
-
202
-
203
-
204
-
205
-
206
-
207
-
208
-
209
-
210
-
211
-
212
-
213
-
214
-
215
-
216
-
217
-
218
-
219
-
220
 |
 |

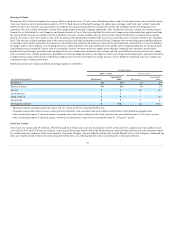
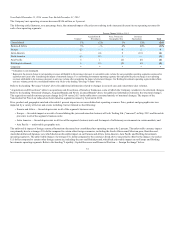
Net Operating Revenues
Year Ended December 31, 2015 versus Year Ended December 31, 2014
The Company's net operating revenues decreased $1,704 million, or 4 percent.
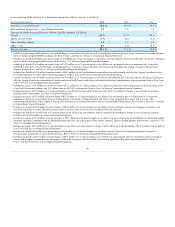
The following table illustrates, on a percentage basis, the estimated impact of key factors resulting in the increase (decrease) in net operating revenues for
each of our operating segments:
Percent Change 2015 vs. 2014
Volume1
Acquisitions &
Divestitures
Price, Product &
Geographic Mix
Currency
Fluctuations
Consolidated 1%
—%
2%
(7)%
Eurasia & Africa 2%
(1)%
3%
(14)%
Europe 2
(1)
1
(9)
Latin America 1
—
9
(23)
North America 1
(1)
3
(1)
Asia Pacific 2
—
(3)
(8)
Bottling Investments 6
3
(3)
(10)
Corporate *
*
*
*
* Calculation is not meaningful.
1 Represents the percent change in net operating revenues attributable to the increase (decrease) in concentrate sales volume for our geographic operating segments (expressed in
equivalent unit cases) after considering the impact of structural changes. For our Bottling Investments operating segment, this represents the percent change in net operating
revenues attributable to the increase (decrease) in unit case volume after considering the impact of structural changes. Our Bottling Investments operating segment data reflects
unit case volume growth for consolidated bottlers only. Refer to the heading "Beverage Volume" above.
Refer to the heading "Beverage Volume" above for additional information related to changes in our unit case and concentrate sales volumes.
"Acquisitions and Divestitures" refers to acquisitions and divestitures of brands or businesses, some of which the Company considers to be structural changes.
Refer to the heading "Structural Changes, Acquired Brands and Newly Licensed Brands" above for additional information related to the structural changes.
The acquisitions and divestitures percent change for 2015 versus 2014 in the table above consisted entirely of structural changes.
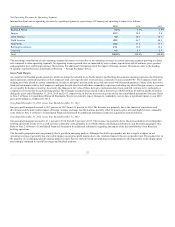
Price, product and geographic mix had a favorable 2 percent impact on our consolidated net operating revenues. Price, product and geographic mix was
impacted by a variety of factors and events including, but not limited to, the following:
• Eurasia and Africa — favorable price mix in most of the segment's business units, partially offset by unfavorable geographic mix;
• Latin America — favorable price mix in all four of the segment's business units and the impact of inflationary environments in certain markets;
• North America — favorably impacted as a result of price increases and package mix;
• Asia Pacific — unfavorable product and channel mix as well as unfavorable geographic mix; and
• Bottling Investments — unfavorable price mix attributable to channel, product and package mix.
The unfavorable impact of foreign currency fluctuations decreased our consolidated net operating revenues by 7 percent. This unfavorable impact was
primarily due to a stronger U.S. dollar compared to certain foreign currencies, including the South African rand, euro, U.K. pound sterling, Brazilian real,
Mexican peso, Australian dollar and Japanese yen, which had an unfavorable impact on our Eurasia and Africa, Europe, Latin America, Asia Pacific and
Bottling Investments operating segments. Refer to the heading "Liquidity, Capital Resources and Financial Position — Foreign Exchange" below.
Net operating revenue growth rates are impacted by sales volume; acquisitions and divestitures; price, product and geographic mix; and foreign currency
fluctuations. The size and timing of acquisitions and divestitures are not consistent from period to period. The Company currently expects acquisitions and
divestitures to have a mid single-digit unfavorable impact on full year 2016 net operating revenues. Based on current spot rates and our hedging coverage in
place, we expect currencies will continue to have an unfavorable impact on our full year 2016 net operating revenues.
50